Skip to content
Here are five beginner-friendly Power BI project ideas to help you practice and build your skills:
1️⃣ Sales Performance Dashboard
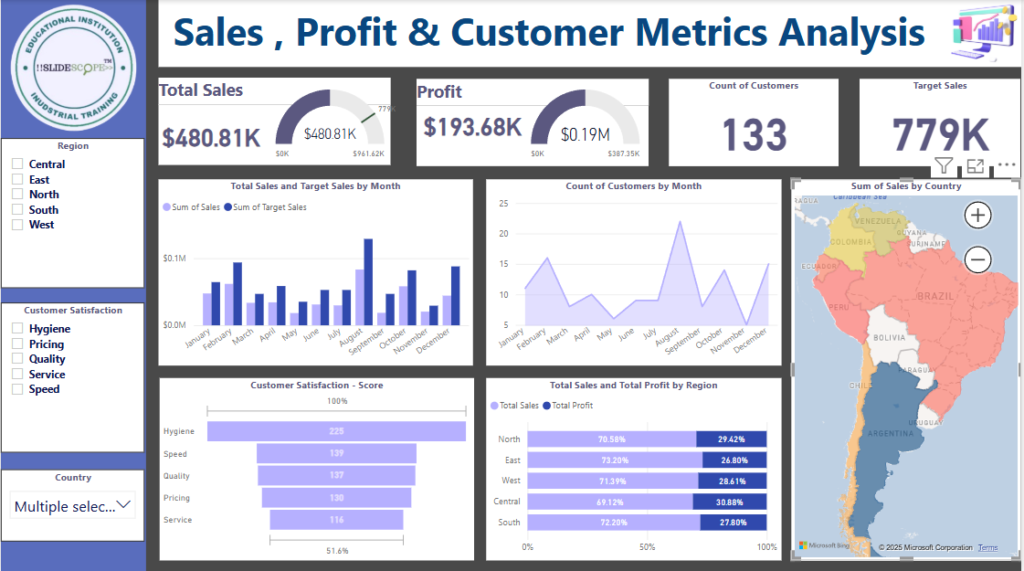
- Data Source: Sample sales data (e.g., Excel, CSV)
- Key Features:
- Total revenue, profit, and sales trends
- Regional sales distribution
- Top-selling products and least-performing items
- Monthly/quarterly/yearly comparisons
- Skills Practiced: Data visualization, DAX measures, filters
2️⃣ Marketing Performance Analysis
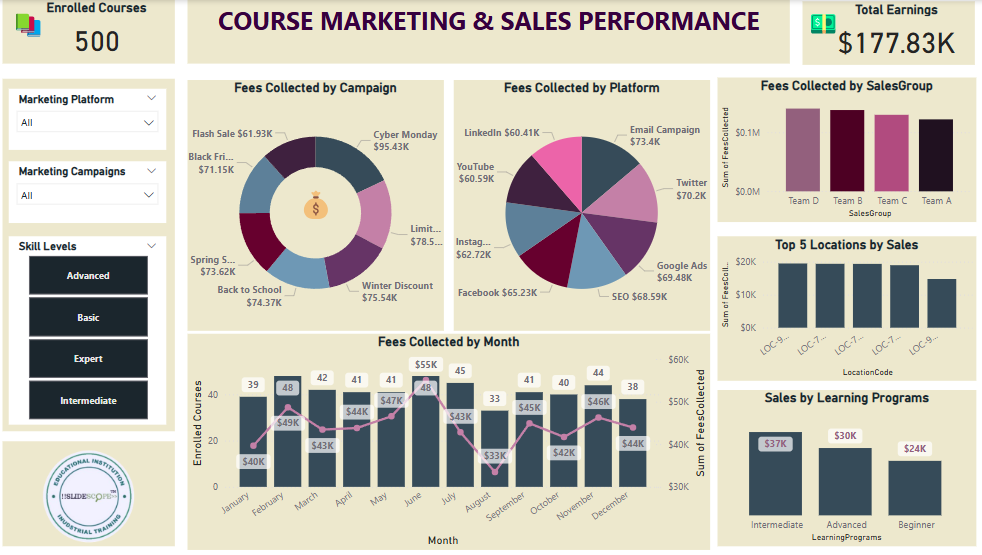
- Data Source: Course Marketing and Sales Data, Google Analytics, CRM/ERP/E-commerce Orders Reports
- Key Features:
- Campaign wise Sales and Profit
- Marketing Platform / Mode wise Sales and Profit
- Visitors / Users / Sales trend over time
- Performance of Sales team / individuals
- Skills Practiced: Data transformation, Power Query editor, data modeling etc.
3️⃣ HR Analytics Dashboard
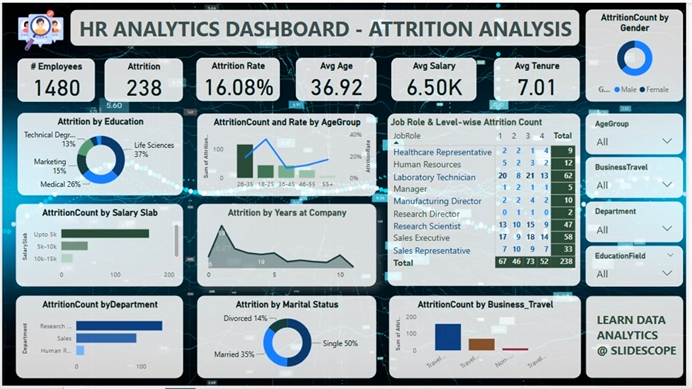
- Data Source: Employee data (Excel, HR database)
- Key Features:
- Employee headcount by department
- Attrition rate and hiring trends
- Salary distribution
- Employee demographics (age, gender, experience)
- Skills Practiced: Data modeling, DAX calculations, interactive visualizations
4️⃣ Medical Test Reports Analysis
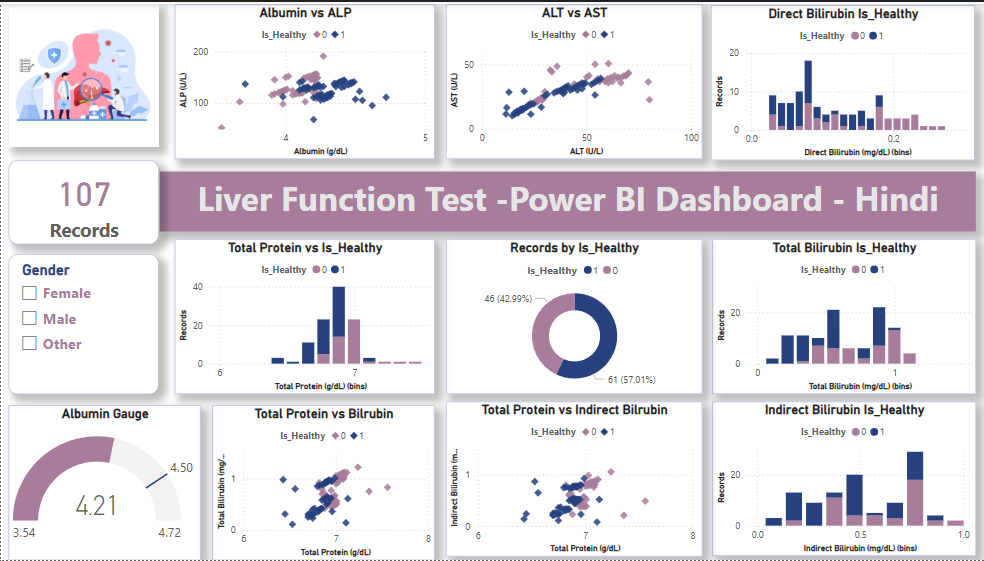
- Data Source: LFT Dataset , KFT Dataset
- Key Features:
- Total records
- Comparison of 2 Continuous numerical values ( regression analysis )
- Distribution of Numerical Values ( Histogram )
- Parameters defining a patient being healthy or unhealthy
- Skills Practiced: Data connections, pathological reports analysis, trend analysis
5️⃣ E-commerce Order Insights
- Data Source: Sample order dataset from an e-commerce platform
- Key Features:
- Total orders, revenue, and profit margin
- Top customers and product categories
- Order processing time analysis
- Return/refund trends
- Skills Practiced: Data cleaning, creating KPIs, building interactive reports
