🎯 Objective
Show the difference between
STDEV.S()andSTDEV.P()DAX functions using real-world data from the Sample Superstore dataset (e.g., Orders table).
📌 Quick Definitions
| Function | Meaning | Divisor Used | When to Use |
|---|---|---|---|
STDEV.S() | Sample Standard Deviation | Divides by n - 1 | Use when data is a sample of the population |
STDEV.P() | Population Standard Deviation | Divides by n | Use when data represents the entire population |
🗃️ Sample Superstore Table Used
We’ll work with the Orders table, especially the [Sales] column.
Let’s say your table has the following simplified sales data:
| Order ID | Sales |
|---|---|
| A | 200 |
| B | 300 |
| C | 400 |
| D | 500 |
| E | 600 |
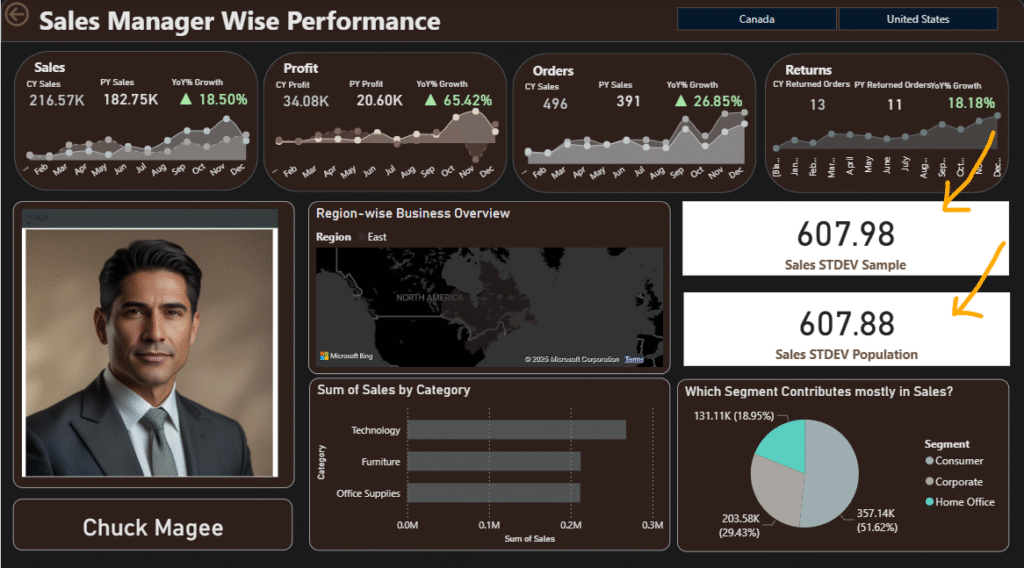
Here in this screenshot you can see how it is applied on Sample Superstore Dataset using Power BI
🧪 DAX Example in Power BI
✅ 1. Sample Standard Deviation
Sales STDEV Sample = STDEV.S(Orders[Sales])
Explanation:
- Uses
n - 1divisor (Bessel’s correction) - Slightly higher standard deviation
- Good for analyzing a subset of all your orders
✅ 2. Population Standard Deviation
Sales STDEV Population = STDEV.P(Orders[Sales])
Explanation:
- Uses
nas divisor - Smaller than
STDEV.S - Use when your dataset includes all orders ever made
📊 Comparison Example
Let’s calculate both with this data:
Sales = [200, 300, 400, 500, 600]
Step 1: Mean
Mean = (200 + 300 + 400 + 500 + 600) / 5 = 2000 / 5 = 400
Step 2: Squared Deviations
(200 - 400)^2 = 40000
(300 - 400)^2 = 10000
(400 - 400)^2 =     0
(500 - 400)^2 = 10000
(600 - 400)^2 = 40000
Sum = 100000
STDEV.P:
= SQRT(100000 / 5) = SQRT(20000) ≈ **141.42**
STDEV.S:
= SQRT(100000 / 4) = SQRT(25000) ≈ **158.11**
✅ Summary
| Function | Formula | Result (Example) | Use Case |
|---|---|---|---|
STDEV.P([Sales]) | √(Σ(x – x̄)² / n) | 141.42 | If entire order history is analyzed |
STDEV.S([Sales]) | √(Σ(x – x̄)² / (n-1)) | 158.11 | If analyzing a sample of orders (e.g., just 1 month or 1 region) |
💡 Real Insight:
- Use
STDEV.Swhen analyzing performance by Region, Category, or a filtered subset (e.g., last 30 days). - Use
STDEV.Pwhen looking at entire dataset trends, e.g., total sales variability across all time.
