By Ankit Srivastava
In today’s data-driven world, businesses no longer make decisions based on gut feeling — they rely on insights drawn from data. This is where the Business Data Analyst steps in — the bridge between business strategy and data science.
As someone who has worked with analytics, reporting systems, and business technology for over a decade, I can confidently say: a Business Data Analyst (BDA) is not just a job role, it’s the heartbeat of decision-making in every modern organization.
If you’ve ever wondered how to become a Business Data Analyst or what exact steps to follow, this roadmap will guide you from beginner to job-ready professional — in 10 clear, structured steps.
🔹 Step 1: Understand What a Business Data Analyst Does
Before you jump into learning tools or coding, it’s crucial to understand the role itself.
A Business Data Analyst is responsible for:
- Collecting data from various business sources (sales, marketing, finance, operations).
- Cleaning, structuring, and interpreting that data.
- Creating dashboards and reports for decision-makers.
- Identifying business trends, KPIs, and opportunities.
- Translating raw data into actionable business insights.
You are the storyteller — using numbers to narrate what’s happening in the business and where it can go next.
🧩 Key skills at this stage: Curiosity, analytical thinking, and communication.
🔹 Step 2: Build a Strong Foundation in Business and Statistics
A successful analyst understands both business logic and data logic.
Start by learning:
- Business Fundamentals: Understand domains like marketing funnels, sales cycles, customer retention, operations efficiency, and finance basics.
- Statistics and Probability: Learn descriptive statistics (mean, median, mode, standard deviation), hypothesis testing, correlation, and regression.
You don’t need a PhD — just enough statistical understanding to make sense of business patterns and validate insights.
🎯 Suggested resources:
- “Business Analytics for Managers” by Gert H. N. Laursen
- Khan Academy (Statistics Basics)
- Coursera’s Business Analytics Specialization
Remember, a great analyst doesn’t just report numbers — they explain why those numbers matter.
🔹 Step 3: Master Microsoft Excel — The Analyst’s Best Friend
Even in 2025, Excel remains the most widely used analysis tool in the world.
Before you move into advanced tools like SQL or Power BI, you must be fluent in Excel:
📘 Learn these core areas:
- Formulas: VLOOKUP, INDEX-MATCH, IF, SUMIFS, COUNTIFS
- Pivot Tables and Charts
- Data Cleaning with Text-to-Columns and Power Query
- Conditional Formatting and Data Validation
- Dashboard creation using slicers and dynamic charts
💡 Pro Tip: Build your own “mini-dashboards” in Excel using sample sales or HR datasets. This builds confidence in transforming raw data into insights.
🔹 Step 4: Learn SQL — The Language of Databases
Once you’ve mastered Excel, the next step is to learn SQL (Structured Query Language) — the backbone of every data system.
Business analysts use SQL to:
- Extract and filter data from databases
- Join multiple tables
- Aggregate data using GROUP BY and HAVING
- Create calculated columns
- Optimize queries for reports
🧠 Example:
SELECT City, AVG(Revenue) AS Avg_Revenue
FROM Sales
WHERE Year = 2024
GROUP BY City
ORDER BY Avg_Revenue DESC;
This one query can replace hours of Excel work — and that’s the magic of SQL.
🎯 Tools to practice: MySQL, PostgreSQL, SQL Server, or even cloud-based tools like Google BigQuery Sandbox.
🔹 Step 5: Learn Data Visualization Tools (Power BI or Tableau)
Power BI Playlist
Tableau Playlist
Now that you can analyze and extract data, it’s time to visualize insights.
Business leaders love dashboards because they simplify complex data into a single glance. Tools like Microsoft Power BI and Tableau are the most in-demand for this role.
Start with Power BI (since it integrates well with Excel and SQL):
- Connect datasets from CSV, Excel, or databases
- Build visualizations (bar, pie, KPI cards, maps)
- Use DAX for calculated measures (SUM, AVERAGE, SWITCH)
- Create interactive dashboards with slicers and filters
Example DAX formula for KPI:
Avg_Sales = AVERAGE(Sales[Revenue])
📈 Project Idea: Create a Sales Performance Dashboard showing revenue trends by region, category, and month.
🔹 Step 6: Learn Python for Data Analysis (Optional but Powerful)
Check our Python Playlist
While not every Business Analyst needs to code, learning Python gives you a serious edge.
With libraries like Pandas, NumPy, and Matplotlib, you can:
- Clean messy datasets
- Perform statistical analysis
- Create visualizations
- Automate repetitive reporting tasks
Example Python snippet:
import pandas as pd
df = pd.read_csv("sales.csv")
avg_revenue = df["Revenue"].mean()
print("Average Revenue:", avg_revenue)
It’s also your stepping stone to roles like Data Scientist or Data Engineer in the future.
🎯 Learn Python basics, then focus on Pandas, data visualization (Matplotlib/Seaborn), and simple reporting scripts.
🔹 Step 7: Learn How to Communicate Insights Effectively
Data storytelling is the soul of business analytics.
You may find the best insights in the world — but if you can’t communicate them clearly, they won’t create impact.
🔑 Focus on:
- Simplifying complex data for non-technical stakeholders
- Using visuals, not tables, to tell stories
- Structuring presentations: Problem → Analysis → Insight → Recommendation
- Writing clear summaries and reports
💬 Remember: The best analysts are not just number crunchers — they’re communicators.
🔹 Step 8: Build Real-World Projects and Portfolio
This is where you prove your skills.
Create 3–5 end-to-end projects that show your analytical journey. For example:
- Sales Dashboard using Power BI
- Data Cleaning in Excel
- https://youtu.be/pLT–Igxihg
- DAX Measures for Revenue, Profit, Discounts
- Visual Insights by Region
- Customer Retention Analysis using SQL
- Identify repeat purchase behavior
- Calculate churn rate and retention KPIs
- Power BI Project : Customer Churn Analysis https://youtu.be/qU3nO80PrGE
- HR Analytics Dashboard
- Visualize employee performance and attrition patterns
- HR Analytics Dashboard in Power BI : https://youtu.be/tGrEGku646A
Upload these projects on GitHub or LinkedIn with clear documentation.
🧱 Pro Tip: Employers don’t just look for certificates — they look for projects that show problem-solving ability.
🔹 Step 9: Learn Basic Data Governance and Business Intelligence Concepts
At this level, you’re ready to go beyond tools — into strategy.
Understand how companies handle:
- Data Warehousing: Where your data lives (Snowflake, BigQuery, SQL Server)
- ETL (Extract, Transform, Load): How raw data becomes usable
- Data Quality and Governance: Why data accuracy matters for decision-making
- KPIs and Metrics Design: How to define measurable success indicators
When you combine analytics with business understanding, you become an invaluable asset — not just an analyst, but a decision partner.
🔹 Step 10: Prepare for Interviews and Continuous Growth
Now that you’re skilled and project-ready, let’s prepare for your career step.
📋 Interview Preparation Tips:
- Practice explaining your projects in simple terms.
- Be ready for scenario-based questions like: “How would you measure marketing campaign success?”
“How do you handle missing data?” - Learn SQL and Excel interview queries.
- Prepare to present a dashboard or analyze a dataset live.
And remember — learning never stops. The data field evolves fast.
Keep upgrading yourself with:
- AI-assisted tools like Copilot for Power BI
- Cloud analytics (Azure Synapse, AWS Redshift)
- Predictive analytics with Python
📚 Follow data communities, take challenges on Kaggle, and share insights on LinkedIn — it builds credibility and keeps your learning sharp.
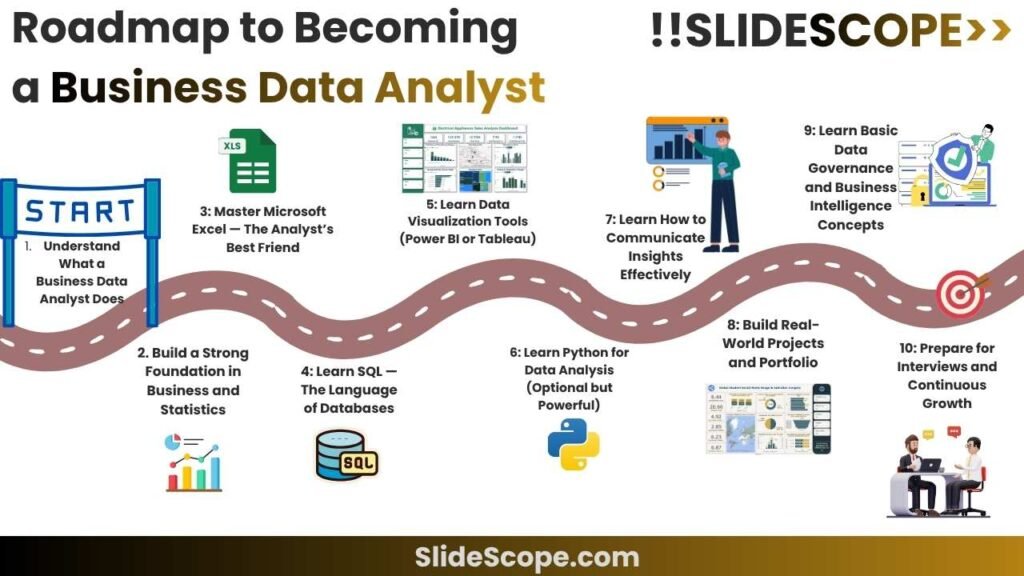
🧭 A Quick Roadmap Summary
Here’s a visual representation of your journey:
graph TD
A[Understand Analyst Role] --> B[Learn Business & Statistics]
B --> C[Master Excel]
C --> D[Learn SQL]
D --> E[Learn Power BI/Tableau]
E --> F[Optional: Learn Python]
F --> G[Develop Data Storytelling Skills]
G --> H[Build Real-World Projects]
H --> I[Learn BI & Governance]
I --> J[Interview Prep & Continuous Growth]
Each step builds upon the previous one — from understanding business to communicating insights like a pro.
💡 Final Thoughts
Becoming a Business Data Analyst is not about mastering one tool — it’s about developing the mindset of curiosity and clarity.
When you analyze data, always ask:
- “What business question am I answering?”
- “How can I turn this data into action?”
In my years of experience implementing business systems, I’ve seen one consistent truth — data doesn’t drive business; insights do.
If you follow this roadmap with focus and consistency, you’ll not only become job-ready but future-proof.
Remember, tools will evolve — Excel to Power BI, SQL to AI-powered analytics — but your foundation of business thinking + analytical reasoning will always keep you ahead.
🌟 Takeaway
Start small, stay consistent, and keep learning. The goal isn’t just to “analyze” data — it’s to influence business decisions through data.
And that’s where your real growth begins. 💼
