By Ankit Srivastava
Financial data has become one of the most powerful drivers of decision-making in modern organizations. From investment firms and banks to startups and global corporations, every institution relies on data to understand financial performance, manage risk, and forecast future growth. A Financial Data Analyst plays a critical role in translating complex financial datasets into insights that guide strategic decisions. In my experience, building a career in financial data analysis requires a combination of finance knowledge, analytical thinking, and technical skills. This roadmap outlines the key steps and competencies needed to develop expertise in financial analytics and build a strong, future-ready career in this field.
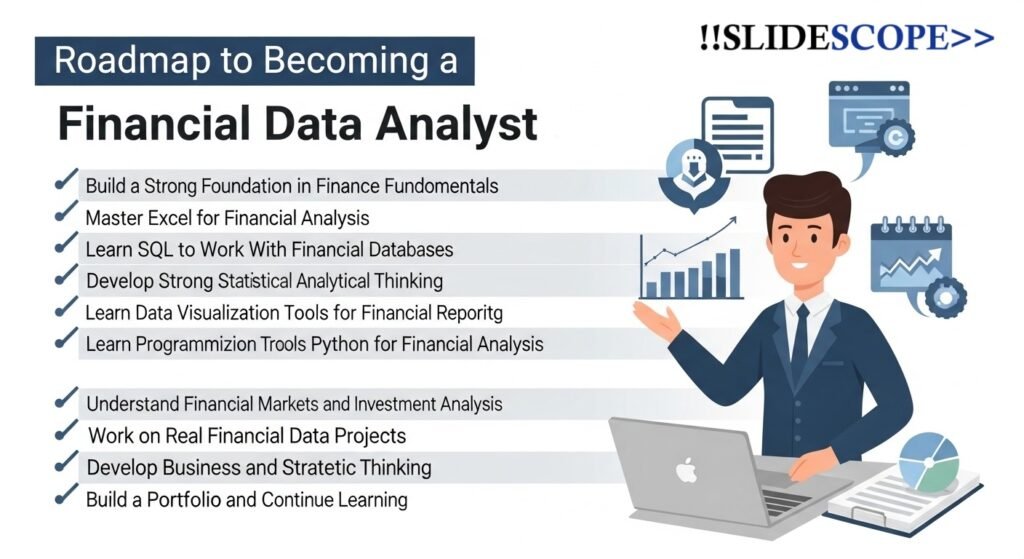
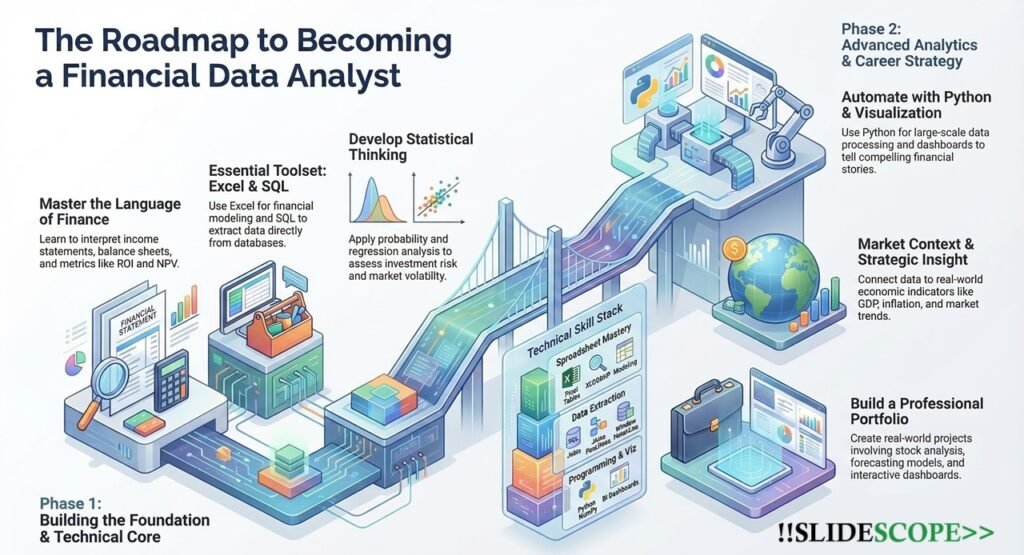
1. Build a Strong Foundation in Finance Fundamentals
The first step to becoming a Financial Data Analyst is understanding the language of finance. Data alone is meaningless unless you know what financial metrics represent and how businesses use them to make decisions. As someone entering this field, you must start by learning the core principles of finance, accounting, and business economics.
Begin with financial statements. Every organization relies on three fundamental reports: the income statement, balance sheet, and cash flow statement. Understanding how these statements connect is critical. For example, revenue growth may look impressive on the income statement, but if cash flow is weak, the company could face operational risks. A financial data analyst must be able to interpret these relationships and identify patterns that affect financial health.
You should also learn important financial metrics such as profit margins, return on investment, net present value, internal rate of return, and earnings per share. These metrics help companies evaluate investments, manage budgets, and track financial performance.
Equally important is learning how financial markets operate. Understanding stocks, bonds, derivatives, and portfolio management will give you insight into how financial data drives investment decisions.
To build this foundation, you can study finance courses, read annual reports of companies, and analyze real financial statements. This practice develops the analytical mindset needed to connect numbers with business realities.
A strong financial foundation ensures that when you analyze datasets later using technical tools, you will interpret them with the right business context. Without this understanding, even the most advanced analytics will lack meaningful insight.
2. Master Excel for Financial Analysis
Excel remains one of the most powerful and widely used tools in financial analysis. Even in large financial institutions that use advanced software, Excel is still the backbone for modeling, forecasting, and quick analysis.
As a Financial Data Analyst, Excel becomes your daily working environment. You will use it to clean financial datasets, build models, calculate metrics, and present insights to decision-makers.
Start by mastering spreadsheet basics such as formulas, formatting, and structured data management. Then move toward advanced financial functions like NPV, IRR, PMT, and scenario modeling tools. These allow analysts to evaluate investments and forecast financial outcomes under different assumptions.
Pivot tables are especially useful for financial datasets. They allow you to summarize large transactional data quickly and identify trends such as monthly revenue patterns or expense categories. Conditional formatting helps highlight anomalies or outliers in financial performance.
You should also learn advanced lookup functions such as VLOOKUP, XLOOKUP, and INDEX-MATCH. These functions allow you to merge datasets, reconcile financial reports, and perform cross-table analysis.
Another critical skill is building financial models in Excel. Financial modeling involves forecasting revenue, costs, profits, and investment outcomes based on assumptions. Companies rely heavily on these models when making strategic decisions such as launching new products, expanding into new markets, or evaluating acquisitions.
By mastering Excel, you develop the ability to quickly translate raw financial data into meaningful insights. It becomes the bridge between financial knowledge and analytical thinking, making it one of the most essential skills for any aspiring Financial Data Analyst.
3. Learn SQL to Work With Financial Databases
Financial organizations deal with enormous amounts of data. Transaction records, investment portfolios, loan histories, customer financial activities, and accounting records are all stored in databases. This is where SQL becomes an essential skill.
SQL allows a Financial Data Analyst to extract and analyze data directly from databases without relying on engineers or IT teams. With SQL, you can retrieve specific financial transactions, analyze revenue patterns, or investigate irregular financial activity.
Start by learning the basics of SQL queries. Understand how to use SELECT statements to retrieve information from tables. Then move to filtering data with WHERE conditions and grouping results with GROUP BY statements.
Joins are particularly important in financial analytics. Financial data often resides in multiple tables, such as transaction records, account details, and customer profiles. Using joins allows you to combine these datasets and build a comprehensive view of financial activity.
Window functions and aggregations are also powerful tools. These help calculate running totals, moving averages, and ranking financial metrics across datasets. For example, you might analyze how a company’s revenue changes month by month or identify the top-performing investment portfolios.
SQL also helps with fraud detection and compliance analysis. Analysts often query transaction patterns to identify unusual activities that might indicate financial risk.
The ability to write efficient SQL queries gives analysts direct access to financial intelligence. Instead of waiting for reports, you can explore the data yourself and uncover insights that influence business decisions.
In modern finance roles, SQL is not just a technical skill; it is a critical capability that enables deeper analytical independence.
4. Develop Strong Statistical and Analytical Thinking
Financial data analysis requires more than technical tools. It requires a mindset built on logical reasoning and statistical understanding. Financial markets and corporate performance involve uncertainty, variability, and risk, which is why statistical thinking becomes essential.
A Financial Data Analyst must understand probability concepts, distributions, and statistical inference. These help analysts determine whether patterns in financial data represent meaningful trends or just random fluctuations.
For example, when analyzing stock returns or market performance, analysts must understand variance and standard deviation. These measures help assess the volatility and risk of investments. Similarly, correlation analysis helps determine how different financial assets move relative to one another.
Hypothesis testing is another valuable skill. Financial analysts often test assumptions such as whether a new investment strategy produces higher returns than existing ones. Statistical testing ensures that decisions are based on evidence rather than intuition.
Regression analysis is widely used in financial modeling. It helps analysts understand relationships between variables such as interest rates, inflation, and stock prices. By identifying these relationships, analysts can forecast potential financial outcomes.
Analytical thinking also involves breaking complex problems into smaller components. For instance, if a company’s profit declines, a Financial Data Analyst should investigate multiple factors such as costs, pricing strategy, market conditions, and operational efficiency.
By developing strong analytical reasoning, you become capable of interpreting financial data in a structured and logical manner. This ability transforms raw data into strategic insights that help organizations manage risk and improve financial performance.
5. Learn Data Visualization for Financial Reporting
Financial data can be complex and overwhelming when presented in spreadsheets or raw numbers. Decision-makers such as executives, investors, and managers need insights that are clear and easy to interpret. This is where data visualization becomes an essential skill.
A Financial Data Analyst must learn how to transform complex financial data into visual dashboards that communicate trends, risks, and opportunities effectively. Visualization tools allow analysts to present key metrics such as revenue growth, expense distribution, investment performance, and financial forecasts.
Charts such as line graphs are useful for tracking financial trends over time. Bar charts help compare financial performance across departments or business units. Pie charts can illustrate how revenue or expenses are distributed among categories.
Modern business intelligence tools allow analysts to create interactive dashboards where users can explore financial data dynamically. Instead of static reports, executives can filter data by time period, department, or region to understand performance more deeply.
Another advantage of visualization is anomaly detection. When financial data is visualized properly, unusual spikes, declines, or irregular patterns become immediately visible.
Storytelling is also an important part of visualization. The goal is not simply to display charts but to guide stakeholders toward understanding the financial story behind the numbers. A well-designed dashboard can quickly communicate whether a company is growing, facing risk, or improving operational efficiency.
By mastering visualization, Financial Data Analysts ensure that their insights influence real decisions rather than remaining hidden in technical reports.
6. Learn Programming Tools Like Python for Financial Analysis
As financial datasets grow larger and more complex, analysts increasingly rely on programming languages to process and analyze information efficiently. Python has become one of the most widely used programming languages in financial analytics.
Python allows analysts to automate data processing tasks, analyze large datasets, and build predictive financial models. Libraries such as pandas help manipulate financial data tables, while NumPy supports numerical analysis and calculations.
Visualization libraries like Matplotlib and Seaborn help create charts that reveal trends in financial markets or company performance. These tools are especially useful when analyzing time series data such as stock prices or economic indicators.
Python is also widely used for financial modeling. Analysts can build simulations to test investment strategies or forecast future revenue under different economic scenarios. Machine learning techniques can also be applied to detect patterns in market behavior.
Another advantage of Python is automation. Financial reports that previously required hours of manual work can be automated using scripts. This allows analysts to focus more on interpretation and strategy rather than repetitive tasks.
For example, an analyst might build a Python program that automatically retrieves market data, calculates performance metrics, and generates a report for stakeholders.
Learning Python adds a powerful layer of analytical capability. It allows Financial Data Analysts to handle complex datasets, conduct deeper analysis, and deliver insights faster.
7. Understand Financial Markets and Investment Analysis
A Financial Data Analyst must understand how financial markets operate. Data analysis becomes far more meaningful when you understand the economic forces behind financial movements.
Financial markets include stock markets, bond markets, commodities, and derivatives. Each market behaves differently and responds to various economic indicators such as interest rates, inflation, and geopolitical events.
Analysts must understand how investors evaluate opportunities. Concepts like portfolio diversification, risk management, and asset allocation are central to investment decisions.
Financial analysts also study valuation methods. Techniques such as discounted cash flow analysis help estimate the intrinsic value of companies. This allows investors to determine whether stocks are overvalued or undervalued.
Market trends also play a role in financial analytics. Analysts study historical market patterns to identify signals that may influence future investment decisions.
Economic indicators such as GDP growth, unemployment rates, and inflation are also closely monitored. These factors affect financial markets and influence corporate financial performance.
By understanding financial markets, analysts can interpret financial datasets with deeper insight. Instead of simply analyzing numbers, they understand the economic context that drives financial outcomes.
8. Work on Real Financial Data Projects
Theory alone cannot prepare you for a financial analytics career. Real expertise comes from working with actual financial datasets and solving practical problems.
You can begin by analyzing publicly available financial data such as stock market datasets, company financial statements, or government economic data. Many financial platforms provide historical data that analysts can use for practice.
A valuable project could involve analyzing a company’s financial performance over several years. By studying revenue trends, expense patterns, and profitability ratios, you can identify strengths and weaknesses in the company’s strategy.
Another useful project involves stock market analysis. Analysts often examine price trends, volatility patterns, and correlations between assets to understand investment behavior.
You could also build financial dashboards that track key performance indicators such as revenue growth, operating margins, or return on equity. These dashboards simulate real-world financial reporting environments.
Portfolio analysis is another valuable exercise. By evaluating the risk and return characteristics of different assets, you can learn how investment strategies affect financial outcomes.
Working on real projects strengthens your analytical thinking and demonstrates your skills to potential employers. Employers often prefer candidates who can show practical experience rather than only academic qualifications.
9. Develop Business and Strategic Thinking
Financial data analysis is not just about numbers; it is about business decisions. A Financial Data Analyst must understand how financial insights influence strategy.
For example, if an analysis reveals that a company’s operating costs are rising faster than revenue, management may need to optimize processes or renegotiate supplier contracts. Similarly, if data shows strong growth in a specific product segment, the company might allocate more resources to expand that area.
Analysts must think beyond the dataset and consider the broader business environment. This includes understanding competitive dynamics, industry trends, and regulatory conditions.
Communication is also critical. Analysts must explain financial insights in a way that executives and managers can easily understand. This means translating complex calculations into clear business recommendations.
For example, rather than presenting technical statistical outputs, a Financial Data Analyst might say:
“If we invest in this project, we can expect a 15 percent return over five years with manageable financial risk.”
By connecting financial analysis with strategic decisions, analysts become trusted advisors within organizations. This ability to bridge data and strategy significantly increases career growth opportunities.
10. Build a Portfolio and Continue Learning
The final step in becoming a Financial Data Analyst is building a strong professional portfolio. A portfolio demonstrates your ability to apply financial analytics skills in real-world situations.
Your portfolio should include projects such as financial dashboards, investment analysis reports, financial forecasting models, and market trend studies. Each project should clearly explain the objective, methodology, and insights derived from the analysis.
You can also publish your work on professional platforms or personal websites. Sharing insights on financial trends or data analysis techniques helps establish your expertise in the field.
Continuous learning is equally important. Financial markets evolve constantly, and new analytical technologies emerge regularly. Staying updated with modern tools, regulatory changes, and economic developments ensures that your skills remain relevant.
Certifications in finance or data analytics can also strengthen your profile. They demonstrate commitment to professional development and signal credibility to employers.
Networking with finance professionals, attending industry webinars, and following financial research publications can also expand your knowledge.
By combining technical skills, financial understanding, and continuous learning, you position yourself for long-term success as a Financial Data Analyst.
If you are serious about building a career as a Financial Data Analyst, the most important step is structured learning combined with hands-on practice. The industry today requires professionals who not only understand finance but can also analyze large datasets, build financial models, and generate insights that influence business strategy. At Slidescope Institute, we focus on practical, industry-oriented training that helps students develop the exact skills companies are looking for. Our programs cover financial analytics, Excel modeling, SQL, data visualization, and real-world project experience so that you graduate with both knowledge and practical exposure. Whether you are a student, working professional, or someone looking to transition into analytics, our training programs are designed to guide you step-by-step toward a successful analytics career.
Contact Us to Join the Course
