Introduction
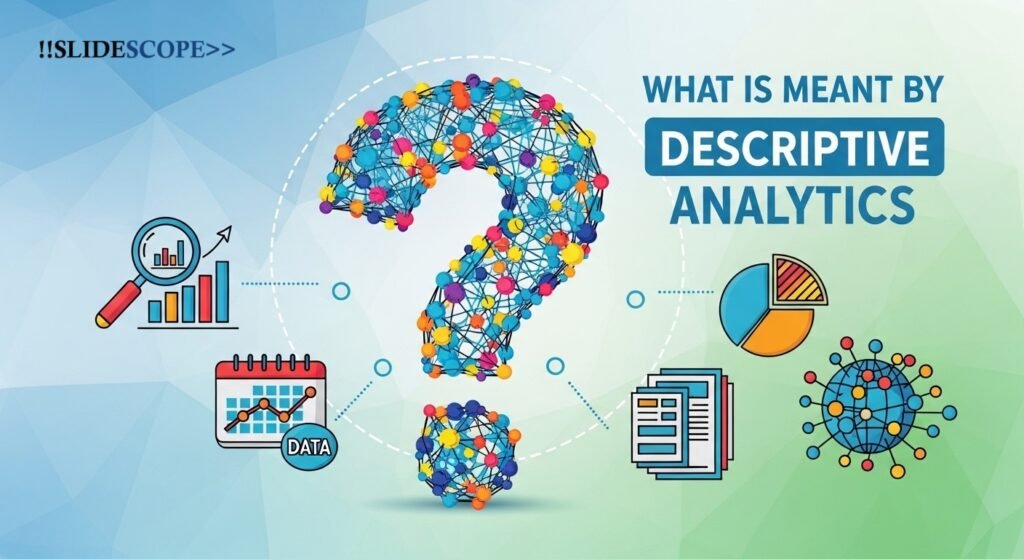
In the modern data-driven world, organizations generate massive amounts of data every day through transactions, digital platforms, sensors, and customer interactions. However, raw data alone does not provide value unless it is analyzed and interpreted. This is where Descriptive Analytics plays a crucial role. Descriptive analytics is the process of analyzing historical data to understand what has happened in the past. It transforms raw data into meaningful insights through aggregation, data mining, and visualization techniques.
Descriptive analytics is often considered the foundation of all data analytics, because it helps organizations summarize large datasets and identify patterns, trends, and relationships. Businesses use descriptive analytics to track performance metrics such as sales growth, customer behavior, website traffic, marketing campaign performance, and operational efficiency. Tools like Excel, Power BI, Tableau, and SQL are commonly used to perform descriptive analytics.
The goal of descriptive analytics is not to predict the future or recommend actions but to provide a clear understanding of past performance so that decision-makers can identify strengths, weaknesses, and opportunities for improvement. By presenting data in dashboards, reports, charts, and summaries, descriptive analytics enables organizations to make informed strategic decisions.
Below are ten key aspects that explain the concept and importance of descriptive analytics in detail.
1. Understanding Historical Data
Descriptive analytics focuses on analyzing historical data to understand what has already happened in a business or system. It examines past events, transactions, and activities to identify patterns and trends that provide meaningful insights. Organizations collect data from various sources such as sales records, customer databases, website analytics, financial reports, and operational systems. Descriptive analytics processes this information and presents it in a summarized format that is easy to interpret.
For example, a retail company may analyze last year’s sales data to understand which products sold the most during specific seasons. Similarly, an e-commerce platform might examine website traffic data to determine which pages attract the highest number of visitors.
By studying historical data, businesses can evaluate their past performance and identify factors that contributed to success or failure. This understanding helps organizations measure progress against goals and benchmarks. It also allows managers to monitor trends such as revenue growth, customer retention, and product demand.
Descriptive analytics therefore serves as a starting point for data-driven decision-making, providing a factual basis for understanding business performance and identifying areas where improvements may be required.
2. Data Aggregation and Summarization
One of the main functions of descriptive analytics is data aggregation and summarization. Raw data is often large, complex, and difficult to interpret. Descriptive analytics processes this data by organizing, grouping, and summarizing it into meaningful formats.
Data aggregation involves combining multiple data points to produce summaries such as totals, averages, percentages, and counts. For example, a company may aggregate daily sales data to calculate monthly or yearly sales performance. Similarly, a marketing team may summarize customer demographics to understand which age groups contribute the most revenue.
Statistical techniques such as mean, median, mode, standard deviation, and frequency distribution are commonly used to summarize data. These methods allow analysts to convert large datasets into simple insights that decision-makers can easily understand.
For instance, a bank might summarize thousands of transactions to determine the average transaction amount or the most common types of financial activities performed by customers. This process helps organizations quickly identify patterns without analyzing each individual data record.
By transforming complex data into simplified summaries, descriptive analytics enables businesses to quickly interpret information and evaluate performance metrics effectively.
3. Identifying Trends and Patterns
Another important aspect of descriptive analytics is identifying trends and patterns within data. Trends represent the general direction in which data values move over time, while patterns reveal recurring relationships or behaviors.
For example, a company might observe that sales increase every year during a particular festive season. This recurring pattern helps businesses plan marketing campaigns and inventory management strategies accordingly. Similarly, a social media platform may analyze user activity to identify peak hours when engagement is highest.
Descriptive analytics uses techniques such as time-series analysis, data visualization, and statistical analysis to uncover these trends and patterns. Graphs, charts, and dashboards make it easier to visualize how data changes over time.
Understanding trends allows organizations to evaluate performance and understand how different factors influence outcomes. For example, a drop in website traffic might indicate technical issues, changes in search engine algorithms, or reduced marketing activity.
By recognizing patterns in historical data, businesses gain valuable insights that help them better understand their operations and customer behavior. These insights become the foundation for strategic planning and future forecasting activities.
4. Use of Data Visualization
Descriptive analytics relies heavily on data visualization techniques to present information in a clear and understandable format. Visualization tools convert complex datasets into graphical representations such as charts, graphs, dashboards, and maps.
Common visualization formats include bar charts, line charts, pie charts, histograms, and heat maps. These visual elements make it easier for decision-makers to quickly grasp trends, comparisons, and distributions in the data.
For example, a line chart can show how sales revenue changes over time, while a bar chart can compare the performance of different product categories. Dashboards allow businesses to monitor key performance indicators (KPIs) in real time.
Visualization is especially important because humans process visual information much faster than numerical data. Instead of reviewing thousands of rows of spreadsheet data, managers can analyze a dashboard to instantly understand business performance.
Tools like Power BI, Tableau, Google Data Studio, and Excel are widely used for creating interactive dashboards and visual reports. These platforms enable analysts to transform raw data into compelling visual stories that support decision-making.
Through visualization, descriptive analytics ensures that data insights are accessible, understandable, and actionable for stakeholders across an organization.
5. Monitoring Key Performance Indicators (KPIs)
Descriptive analytics plays a crucial role in monitoring Key Performance Indicators (KPIs), which are measurable values that indicate how effectively an organization is achieving its objectives. Businesses define KPIs to track performance in areas such as sales, marketing, finance, operations, and customer service.
For example, a company may monitor KPIs such as monthly revenue, customer acquisition rate, website conversion rate, or average order value. Descriptive analytics collects and summarizes data related to these metrics, allowing managers to evaluate progress over time.
Dashboards and reports are commonly used to display KPI performance. If a KPI shows declining performance, managers can investigate the underlying causes and take corrective actions. For instance, if website conversions decrease, marketing teams may review campaign strategies or improve user experience.
Tracking KPIs through descriptive analytics helps organizations maintain transparency and accountability. It also ensures that decision-makers have accurate data to assess whether strategic goals are being achieved.
By continuously monitoring KPIs, businesses can measure success, identify inefficiencies, and ensure that operations remain aligned with organizational objectives.
6. Performance Reporting
Descriptive analytics is widely used for performance reporting, which involves summarizing data into structured reports that communicate insights to stakeholders. Organizations generate reports on a regular basis—daily, weekly, monthly, or quarterly—to evaluate performance across different departments.
For example, a sales department may produce monthly sales reports showing revenue by region, product category, and salesperson. Similarly, marketing teams may generate reports on campaign performance, including metrics such as impressions, clicks, and conversions.
Performance reports often include tables, charts, and summary statistics that highlight key insights. These reports help executives and managers understand how the organization is performing and whether strategic initiatives are producing desired results.
Automated reporting systems are increasingly used to streamline this process. Tools such as Power BI, Tableau, and business intelligence platforms can automatically update reports as new data becomes available.
Effective performance reporting ensures that organizations maintain transparency and accountability. It also enables decision-makers to communicate insights across teams and departments.
Through descriptive analytics, businesses can transform complex datasets into structured reports that support informed decision-making.
7. Data Quality Assessment
Descriptive analytics also helps organizations assess data quality and integrity. Before data can be used for advanced analytics or decision-making, it must be accurate, complete, and reliable.
Data quality assessment involves examining datasets for issues such as missing values, duplicate records, inconsistent formatting, and incorrect data entries. Descriptive statistics and exploratory data analysis techniques help analysts identify these problems.
For example, if a dataset shows unexpected spikes or anomalies in sales figures, analysts may investigate whether the data contains errors or unusual events. Similarly, missing values in customer records might indicate issues with data collection systems.
Ensuring data quality is essential because inaccurate data can lead to misleading insights and poor decisions. Descriptive analytics provides the tools needed to evaluate data integrity and ensure that datasets are trustworthy.
Organizations often implement data cleaning and validation processes based on insights obtained through descriptive analysis. These processes improve the reliability of data used for reporting and analytics.
By assessing and improving data quality, descriptive analytics strengthens the foundation for more advanced analytical techniques such as predictive and prescriptive analytics.
8. Supporting Business Intelligence Systems
Descriptive analytics is a key component of Business Intelligence (BI) systems. BI platforms collect, process, and analyze organizational data to provide actionable insights for decision-makers.
In a typical BI environment, descriptive analytics is used to generate dashboards, reports, and summaries that provide a comprehensive view of business performance. These insights help executives monitor operations, track KPIs, and identify opportunities for improvement.
For instance, a BI dashboard might display metrics such as sales performance by region, customer acquisition trends, inventory levels, and operational efficiency indicators. These visual insights allow managers to quickly assess the current state of the business.
Modern BI tools integrate data from multiple sources, including databases, cloud platforms, and enterprise systems. Descriptive analytics processes this data and presents it in a structured format that supports decision-making.
By enabling organizations to understand historical performance and operational metrics, descriptive analytics forms the core analytical layer of business intelligence systems.
9. Enhancing Organizational Decision-Making
Although descriptive analytics primarily focuses on understanding past data, it still plays a vital role in supporting decision-making. By providing accurate insights into historical performance, descriptive analytics helps managers make informed strategic choices.
For example, if sales data shows that certain products consistently outperform others, companies may allocate more resources to promoting those products. Similarly, if customer feedback indicates dissatisfaction with a particular service, businesses can implement improvements.
Descriptive analytics also helps organizations evaluate the effectiveness of previous decisions. By analyzing the outcomes of past strategies, managers can determine which approaches were successful and which ones require adjustment.
Decision-makers rely on descriptive insights to answer questions such as:
- What were our total sales last quarter?
- Which marketing campaign generated the most leads?
- Which regions performed best?
These insights provide the context necessary for planning future initiatives and allocating resources effectively.
Thus, descriptive analytics acts as a data-driven foundation for informed decision-making within organizations.
10. Foundation for Advanced Analytics
Descriptive analytics is often considered the first stage in the data analytics lifecycle, forming the foundation for more advanced analytical techniques such as predictive analytics and prescriptive analytics.
Before organizations can forecast future trends or recommend optimal actions, they must first understand historical data. Descriptive analytics provides this understanding by summarizing past events and identifying patterns.
For example, predictive analytics uses historical data analyzed through descriptive methods to forecast future sales or customer behavior. Similarly, prescriptive analytics builds upon these insights to recommend specific actions that organizations should take.
Without descriptive analytics, advanced analytics models would lack reliable input data and contextual understanding. Therefore, descriptive analysis is essential for building accurate predictive models and effective decision-support systems.
Many modern analytics workflows begin with exploratory data analysis (EDA), which is a form of descriptive analytics used to examine datasets before applying machine learning or predictive algorithms.
By providing the groundwork for deeper insights, descriptive analytics ensures that organizations can progress toward more sophisticated data-driven strategies.
