How to Build Star and Snowflake Schemas in Power BI for Sales vs Budget Analysis
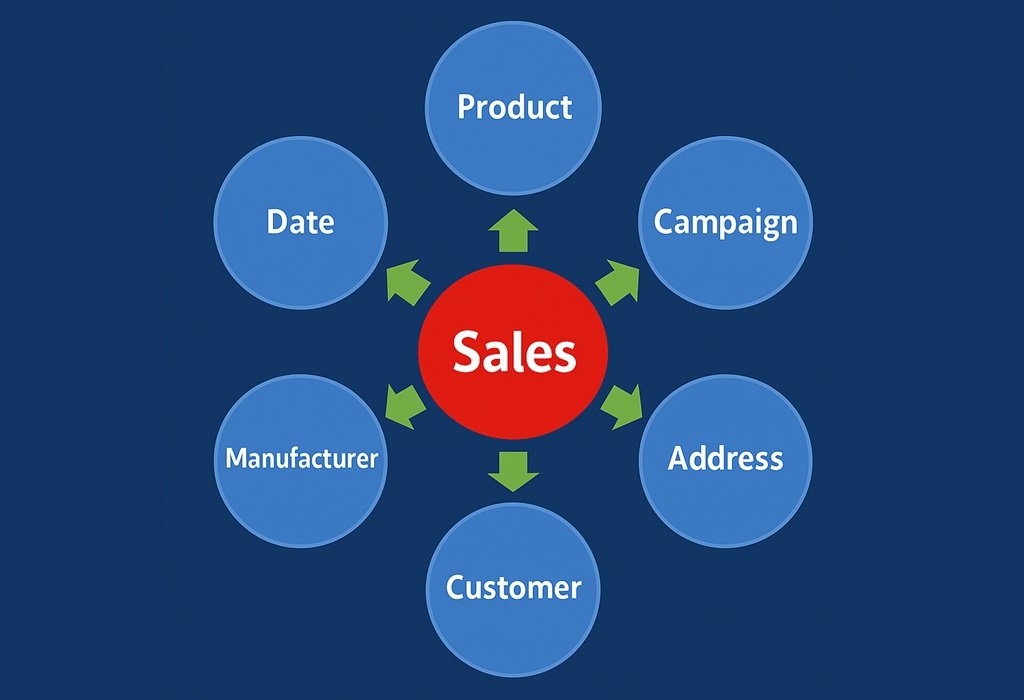
Power BI offers powerful data modeling capabilities that go far beyond just visualizations. In this step-by-step tutorial, we’ll walk through building Star and Snowflake schemas in Power BI using a dataset that includes Sales, Budget, and multiple dimension tables. 📁 Dataset Overview We are working with the following tables: Fact Tables: Dimension Tables: The difference …
How to Build Star and Snowflake Schemas in Power BI for Sales vs Budget Analysis Read More »