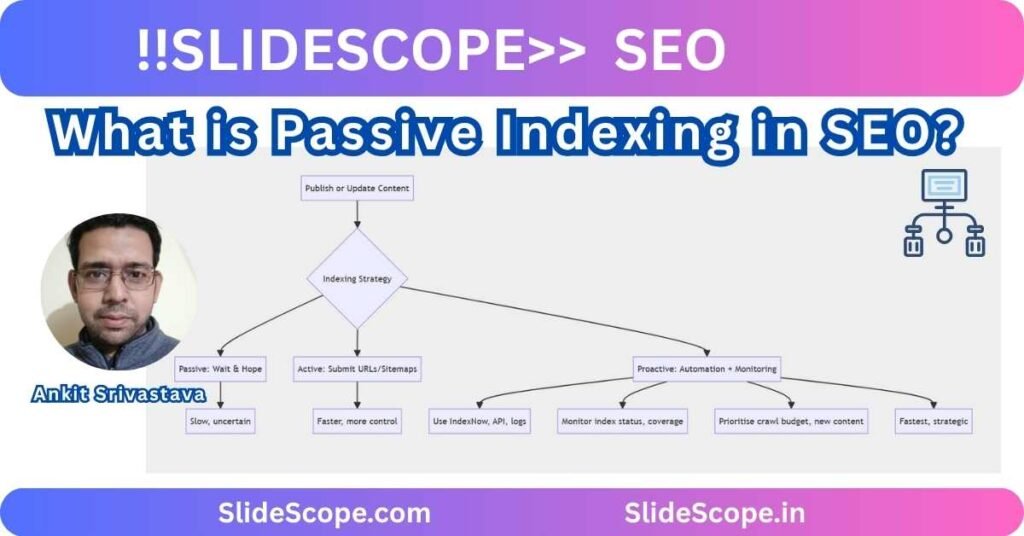
Use of Data Analysis ToolPak in Excel

The Data Analysis ToolPak in Excel is a powerful tool for performing various statistical analyses quickly and efficiently. Below are examples of how to use the Data Analysis ToolPak for different types of analysis, along with step-by-step instructions. 1. Descriptive Statistics Use Case: Summarize data with metrics like mean, median, standard deviation, and range. Example: …

Use of Data Analysis ToolPak in Excel Read More »

Correlation and Regression Analysis in Excel with Examples

What is Correlation and Regression? Example Dataset Year Ad Budget ($) Revenue ($) 2020 5000 100000 2021 7000 120000 2022 8000 140000 2023 9000 160000 2024 10000 180000 Step 1: Calculate Correlation in Excel Step 2: Perform Regression Analysis in Excel Steps to Run Regression: Interpreting Regression Output: Visualization: Insights from the Example: Sample Output …

Correlation and Regression Analysis in Excel with Examples Read More »

Show Images from Image URL field in Power BI Dynamically

Here’s an example dataset with image URLs that you can use to demonstrate displaying images in Power BI: Dataset Example: Animals with Image URLs Animal Name Description Image URL Cat Domestic feline https://cdn2.thecatapi.com/images/MTY3ODIyMQ.jpg Dog Domestic canine https://images.dog.ceo/breeds/hound-afghan/n02088094_1003.jpg Elephant Large mammal https://upload.wikimedia.org/wikipedia/commons/3/37/African_Bush_Elephant.jpg Panda Giant panda bear https://upload.wikimedia.org/wikipedia/commons/0/0f/Grosser_Panda.JPG Tiger Wild feline predator https://upload.wikimedia.org/wikipedia/commons/5/56/Tiger.50.jpg Steps to Use in …

Show Images from Image URL field in Power BI Dynamically Read More »

Descriptive Statistics in Excel: Mean, Median, Mode, Standard Deviation

Descriptive statistics help summarize data using central tendency and variability measures like mean, median, mode, and standard deviation. Here’s an explanation of each, with examples. 1. Mean (Average) The mean is the sum of all values divided by the total number of values. Example: Dataset: Values 10 20 30 40 50 Formula in Excel: 2. …

Descriptive Statistics in Excel: Mean, Median, Mode, Standard Deviation Read More »