Introduction
Hi, I’m Ankit Srivastava — Digital Marketing Consultant, AI Educator, and IT Trainer with over 10 years of experience helping businesses and professionals make sense of data. One thing I hear constantly from students and clients is: “Data analytics sounds powerful, but honestly, I don’t fully understand what it means anymore — everything keeps changing.”
That confusion is fair. Data analytics used to mean pulling numbers into Excel and building a pivot table. Today, it spans AI copilots, automated machine learning, edge devices analyzing data in real time, and tools that write their own summaries of what happened in your business last week.
In this article, I want to strip away the buzzwords and give you a clear, practical picture of where data analytics is heading in 2026 — what’s genuinely new, how different industries are actually using it, and what it means for your career or business, regardless of your technical background.
Let’s demystify it, one trend at a time.
What Data Analytics Really Means Today
Before jumping into trends, let’s ground ourselves in a simple definition: data analytics is the process of examining data to find patterns, answer questions, and support better decisions.
What’s changed isn’t the goal — it’s how we get there. A decade ago, this meant manual spreadsheets and static reports. Today, it increasingly means AI systems that do much of the heavy lifting automatically, leaving humans to interpret and act on the results rather than manually crunch numbers.
With that context, here are the trends genuinely reshaping the field in 2026.
Trend 1: Augmented Analytics — AI as Your Analysis Copilot
The Shift
Augmented analytics uses AI to automatically surface insights, suggest correlations, and highlight anomalies in your data — without you having to know exactly what question to ask first. Instead of you searching for insights, the system increasingly points them out to you.
A Simple Way to Understand It
Think of it like a spell-checker, but for data. You don’t need to know every grammar rule to write well; the tool flags issues for you. Augmented analytics works similarly — it flags a sudden dip in customer retention or an unusual spike in returns before you even think to look for it.
Business Example
A retail client I worked with had an augmented analytics tool flag an unexpected drop in repeat purchases from a specific city — something their team hadn’t noticed manually. It turned out to be a delivery delay issue that was quietly hurting customer trust.
Trend 2: AutoML — Machine Learning Without Needing a PhD
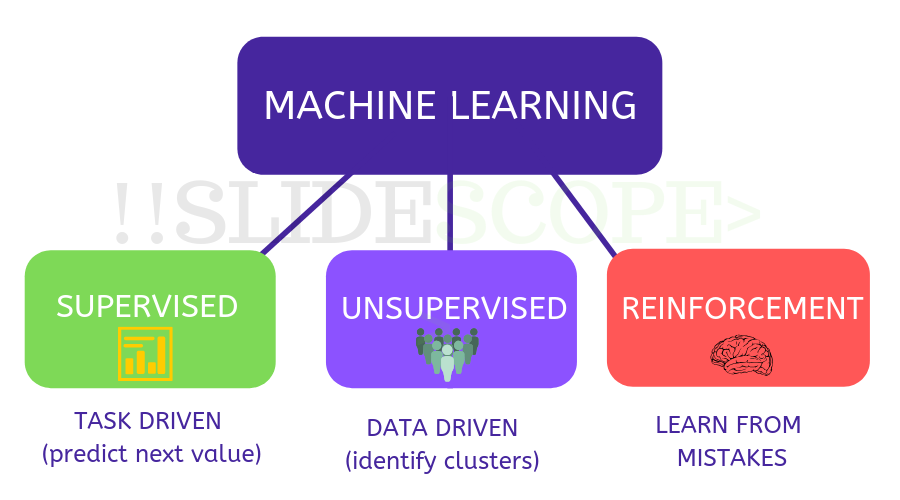
Automated Machine Learning (AutoML) platforms let people with basic data skills build predictive models — like forecasting sales or predicting customer churn — without deep expertise in statistics or coding.
This is genuinely democratizing predictive analytics. In 2026, marketing managers and operations leads, not just data scientists, are building their own forecasting models using drag-and-drop AutoML tools integrated into platforms like Power BI and Google’s analytics suite.
Trend 3: Edge Analytics — Insights Generated Where Data Is Created
Why It Matters
Instead of sending all data to a central cloud server for analysis, edge analytics processes data directly on the device generating it — a factory sensor, a delivery truck, a retail camera — and only sends the relevant insight upstream.
Real-World Use
Manufacturing plants use edge analytics to detect equipment vibrations that suggest a machine is about to fail, triggering maintenance before a breakdown — all decided locally, in milliseconds, without waiting on a round trip to the cloud.
Why It’s Growing in 2026
As IoT devices multiply and 5G expands, edge analytics reduces latency, bandwidth costs, and dependency on constant connectivity — making it essential for industries like manufacturing, logistics, and healthcare monitoring.
Trend 4: Multimodal Analytics — Beyond Just Rows and Columns
Traditional analytics focused on structured, tabular data. In 2026, AI models increasingly analyze multiple data types together — text reviews, call transcripts, product images, and even video — to generate a fuller picture.
Example
A hospitality brand I consulted for combines guest review text, social media images, and booking data into a single analysis to understand why satisfaction scores dropped in a specific property — something numbers alone couldn’t fully explain.
Trend 5: Explainable AI (XAI) — Trusting the “Why” Behind the Answer
As AI makes more analytical decisions, businesses are demanding to know why a model reached a conclusion, not just the conclusion itself. Explainable AI techniques break down which factors most influenced a prediction — critical in regulated industries like finance, insurance, and healthcare, where “the AI said so” isn’t an acceptable answer to a regulator or a customer.
Trend 6: The Rise of the Citizen Data Scientist
With no-code and low-code analytics tools maturing, more non-technical employees — marketers, HR managers, finance teams — are directly building reports, dashboards, and even simple predictive models themselves.
This doesn’t eliminate the need for skilled data professionals; instead, it shifts their role toward building solid data foundations, governance, and mentoring these “citizen data scientists” across the organization.
How Different Industries Are Applying These Trends
Healthcare
Predictive models flag patients at risk of readmission; edge analytics on wearable devices monitors vitals in real time and alerts caregivers before a crisis develops.
Retail and E-commerce
Augmented analytics identifies which products are trending hours after launch, while AutoML powers personalized recommendation engines without a dedicated data science team.
Finance
Explainable AI is now essential for credit scoring and fraud detection models, since regulators require clear justification for automated decisions affecting customers.
Manufacturing
Edge analytics on production lines predicts equipment failure and quality defects in real time, reducing downtime and waste.
Marketing
Multimodal analytics combines campaign performance data with creative assets (images, video, ad copy) to determine which specific creative elements are actually driving conversions.
Common Misconceptions About Modern Data Analytics
- “AI tools eliminate the need to understand data basics.” Not true — you still need to understand what a metric actually measures to interpret AI-generated insights correctly.
- “More data automatically means better insights.” Poor-quality or irrelevant data leads to poor insights, regardless of tool sophistication.
- “Augmented analytics replaces analysts.” It removes repetitive manual work, but human judgment is still essential for context, strategy, and validating results.
- “Edge analytics is only for large enterprises.” Affordable IoT and edge computing tools have made this accessible to mid-sized businesses too.
FAQs
Q1: Do I need to learn coding to work in data analytics in 2026? Not necessarily to get started — tools like Power BI, AutoML platforms, and AI copilots let you contribute without deep coding skills. However, learning SQL and basic Python will significantly expand what you can do and how far you can grow in the field.
Q2: What’s the difference between augmented analytics and AutoML? Augmented analytics focuses on automatically surfacing insights and patterns in existing data. AutoML focuses specifically on building predictive models automatically. They often work together in modern BI platforms.
Q3: Is edge analytics relevant outside of manufacturing? Yes — retail (smart cameras), logistics (fleet tracking), healthcare (wearables), and even smart agriculture increasingly rely on edge analytics for real-time decision-making.
Q4: How can I start learning data analytics as a complete beginner? Start with Excel and basic statistics, move into SQL and data visualization tools like Power BI or Tableau, and then explore Python and AI-assisted analytics tools once you’re comfortable with the fundamentals.
Conclusion
Data analytics in 2026 isn’t a single skill anymore — it’s a rapidly expanding toolkit that spans augmented insights, automated machine learning, edge computing, and multimodal AI. The businesses and professionals who benefit most won’t necessarily be the ones using the flashiest tools, but the ones who genuinely understand their data, ask the right questions, and know how to validate what AI hands back to them.
If this article helped demystify where the field is heading, the natural next step is building real, hands-on skills rather than just staying aware of trends. Explore our structured data analytics and IT training courses at SlideScope.com, designed to take you from fundamentals to job-ready, practical expertise.

Ankit Srivastava is an IT trainer, technology educator, and digital skills mentor with expertise in programming, data analytics, AI, and software development. He has successfully trained thousands of learners, with more than 10,000 student enrollments on Udemy. His practical teaching approach empowers students and professionals to build in-demand technical skills. Colorstech channel where Ankit posts video tutorials has more than 8000 Subscribers.