
🎯 Objective
Show the difference between
STDEV.S()andSTDEV.P()DAX functions using real-world data from the Sample Superstore dataset (e.g., Orders table).
📌 Quick Definitions
| Function | Meaning | Divisor Used | When to Use |
|---|---|---|---|
STDEV.S() | Sample Standard Deviation | Divides by n - 1 | Use when data is a sample of the population |
STDEV.P() | Population Standard Deviation | Divides by n | Use when data represents the entire population |
🗃️ Sample Superstore Table Used
We’ll work with the Orders table, especially the [Sales] column.
Let’s say your table has the following simplified sales data:
| Order ID | Sales |
|---|---|
| A | 200 |
| B | 300 |
| C | 400 |
| D | 500 |
| E | 600 |
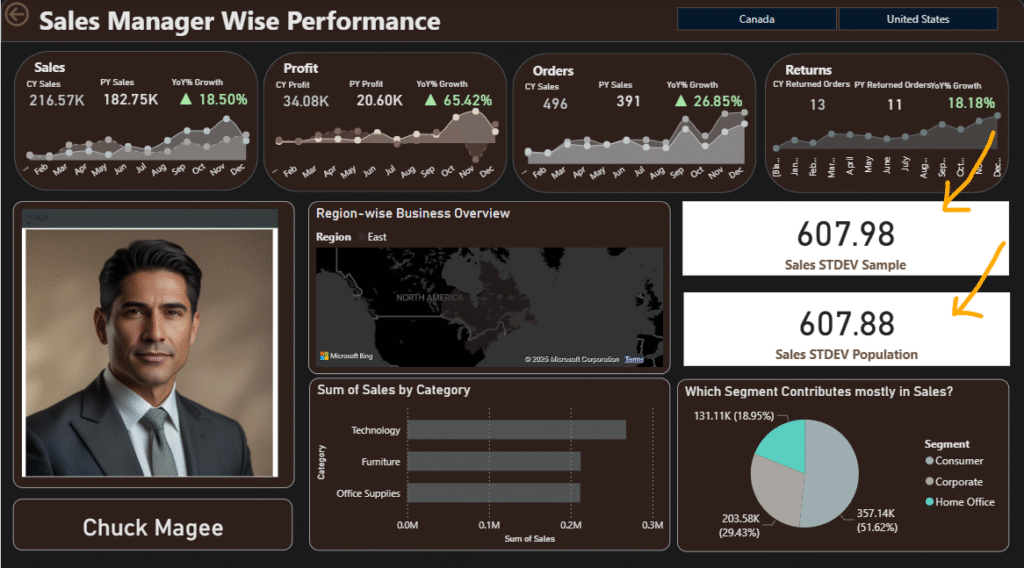
Here in this screenshot you can see how it is applied on Sample Superstore Dataset using Power BI
🧪 DAX Example in Power BI
✅ 1. Sample Standard Deviation
Sales STDEV Sample = STDEV.S(Orders[Sales])
Explanation:
- Uses
n - 1divisor (Bessel’s correction) - Slightly higher standard deviation
- Good for analyzing a subset of all your orders
✅ 2. Population Standard Deviation
Sales STDEV Population = STDEV.P(Orders[Sales])
Explanation:
- Uses
nas divisor - Smaller than
STDEV.S - Use when your dataset includes all orders ever made
📊 Comparison Example
Let’s calculate both with this data:
Sales = [200, 300, 400, 500, 600]
Step 1: Mean
Mean = (200 + 300 + 400 + 500 + 600) / 5 = 2000 / 5 = 400
Step 2: Squared Deviations
(200 - 400)^2 = 40000
(300 - 400)^2 = 10000
(400 - 400)^2 =     0
(500 - 400)^2 = 10000
(600 - 400)^2 = 40000
Sum = 100000
STDEV.P:
= SQRT(100000 / 5) = SQRT(20000) ≈ **141.42**
STDEV.S:
= SQRT(100000 / 4) = SQRT(25000) ≈ **158.11**
✅ Summary
| Function | Formula | Result (Example) | Use Case |
|---|---|---|---|
STDEV.P([Sales]) | √(Σ(x – x̄)² / n) | 141.42 | If entire order history is analyzed |
STDEV.S([Sales]) | √(Σ(x – x̄)² / (n-1)) | 158.11 | If analyzing a sample of orders (e.g., just 1 month or 1 region) |
💡 Real Insight:
- Use
STDEV.Swhen analyzing performance by Region, Category, or a filtered subset (e.g., last 30 days). - Use
STDEV.Pwhen looking at entire dataset trends, e.g., total sales variability across all time.

Ankit Srivastava is an IT trainer, technology educator, and digital skills mentor with expertise in programming, data analytics, AI, and software development. He has successfully trained thousands of learners, with more than 10,000 student enrollments on Udemy. His practical teaching approach empowers students and professionals to build in-demand technical skills. Colorstech channel where Ankit posts video tutorials has more than 8000 Subscribers.

