
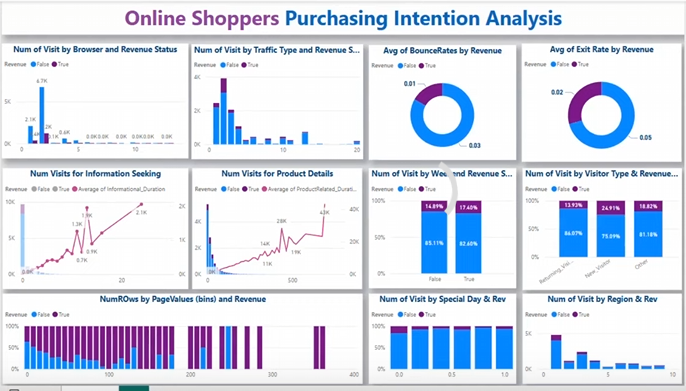
In today’s data-driven world, a Business Intelligence (BI) dashboard is one of the most valuable tools an organization can have. It enables decision-makers to monitor key metrics, spot trends, and make informed decisions. However, one of the most frequently asked questions when initiating a BI project is: “How much time will it take to build a full-fledged, production-level BI dashboard?”
Short Answer: It Depends.
The time required to build a BI dashboard varies based on several factors including the complexity of data, number of metrics, integration points, business logic, and visual customization. A basic dashboard might take a few days, while a highly interactive, production-grade dashboard with multiple data sources can take 4 to 12 weeks or even more.
Key Factors That Affect Timeline
Let’s break down the factors that influence the time it takes:
1. Business Requirements & Stakeholder Inputs
Gathering detailed requirements is often underestimated. It usually takes 1 to 2 weeks to define:
- What KPIs and metrics to track
- Who the end users are
- What decisions will be made based on the dashboard
This phase may involve multiple iterations, especially in larger organizations.
2. Data Availability & Data Quality
If the required data is clean, stored in a centralized warehouse, and easily accessible, the job becomes easier. However, if the data is scattered across multiple systems, or is inconsistent, expect 2 to 4 weeks or more just for:
- Data cleaning
- Standardization
- Integration using ETL pipelines
3. Tool Selection & Setup
Whether using Power BI, Tableau, Looker, or open-source tools like Metabase or Superset, choosing the right tool and configuring access, servers, and permissions can take another 2–5 days.
4. Dashboard Design and Prototyping
Creating the UI/UX for the dashboard—layout, charts, filters, and interactivity—typically requires 1 to 2 weeks, especially if wireframes are to be approved by stakeholders.
5. Development and Integration
This is the heart of the process. It involves:
- Writing complex SQL queries or DAX calculations
- Building charts, filters, and interactions
- Integrating real-time or batch data pipelines
This phase can take 2 to 4 weeks, depending on dashboard complexity.
6. Testing and Validation
It’s not just about “does the dashboard load?” but:
- Are the numbers correct?
- Do filters work correctly?
- Does it perform under load?
Expect 1 to 2 weeks for proper QA, including user acceptance testing (UAT).
7. Deployment & Training
Finally, the dashboard is pushed to production. This includes:
- Setting up refresh schedules
- Assigning access controls
- Training users on how to use the dashboard
This may take 2–5 days.
Real-World Example: Sales Dashboard for a Retail Chain
Let’s take the example of a retail chain with 150+ stores across the country. The goal was to build a dashboard for regional managers to track:
- Daily sales
- Top-selling products
- Inventory levels
- Promotions performance
- Regional comparisons
Here’s how the timeline played out:
| Phase | Duration | Key Activities |
|---|---|---|
| Requirements Gathering | 1.5 weeks | Stakeholder interviews, KPI definitions |
| Data Engineering | 3 weeks | Connecting POS, CRM, inventory databases; cleaning data |
| Tool Setup | 3 days | Power BI setup, user access configuration |
| Dashboard Prototyping | 1.5 weeks | Draft layout, feedback loop |
| Development | 3 weeks | DAX logic for sales KPIs, product ranking, dynamic filtering |
| Testing & UAT | 2 weeks | Cross-checking figures with finance, testing filters and speed |
| Deployment & Training | 1 week | Launch on internal portal, user training webinars |
Total Duration: 10–11 weeks
The timeline included unexpected delays, such as:
- Data discrepancies between systems
- A mid-project change request to include real-time store performance using APIs
However, post-deployment, the dashboard helped regional managers increase stock turnover by 12% in the first quarter, thanks to better visibility of slow-moving inventory.
Tips to Speed Up BI Dashboard Projects
- Start with a prototype – A clickable mockup can speed up stakeholder alignment.
- Use agile sprints – Don’t wait until the end to show results. Iterative releases help refine direction.
- Automate ETL early – Invest in building a robust pipeline from day one.
- Limit scope initially – Launch with a Minimum Viable Dashboard (MVD), then expand.
- Get buy-in early – Regular feedback from end-users helps reduce rework.
Conclusion
Building a full-fledged, production-level BI dashboard isn’t just about dragging charts onto a canvas. It’s a structured process involving requirements, data engineering, design, development, and deployment. While simple dashboards can go live in a few days, enterprise-grade dashboards often require 8–12 weeks from start to finish.
By understanding the factors involved and planning accordingly, businesses can ensure timely delivery and better ROI from their BI investments.

Ankit Srivastava is an IT trainer, technology educator, and digital skills mentor with expertise in programming, data analytics, AI, and software development. He has successfully trained thousands of learners, with more than 10,000 student enrollments on Udemy. His practical teaching approach empowers students and professionals to build in-demand technical skills. Colorstech channel where Ankit posts video tutorials has more than 8000 Subscribers.

