Power BI offers powerful data modeling capabilities that go far beyond just visualizations. In this step-by-step tutorial, we’ll walk through building Star and Snowflake schemas in Power BI using a dataset that includes Sales, Budget, and multiple dimension tables.
📁 Dataset Overview
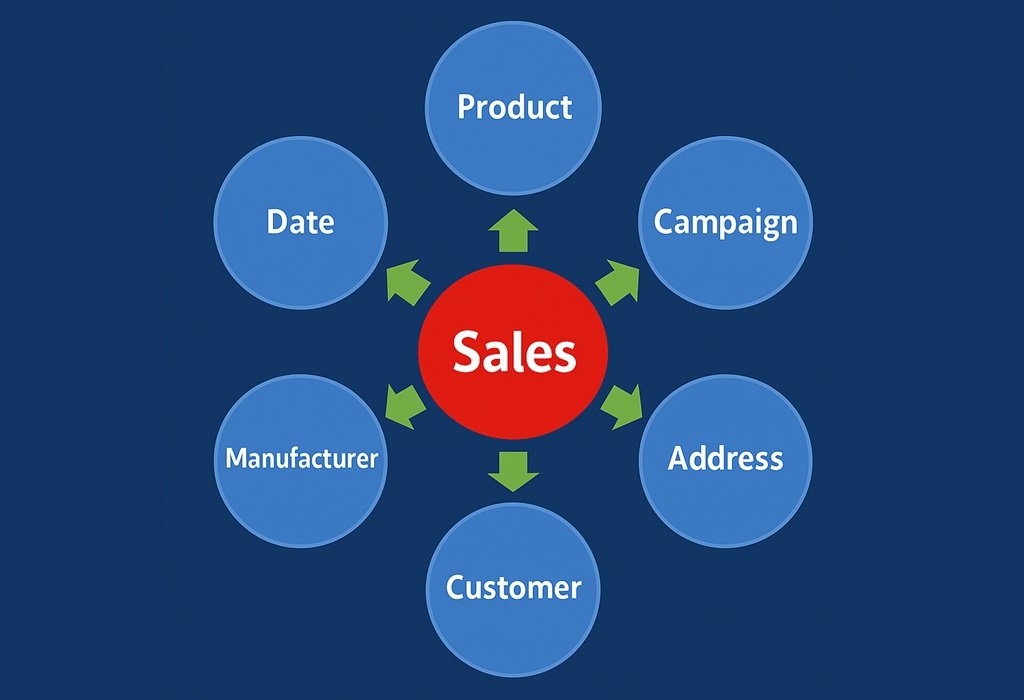
We are working with the following tables:
Fact Tables:
- Sales – Actual sales transactions
- Budget – Forecasted/budgeted values
Dimension Tables:
- Date
- Product
- Customer
- Campaign
- CategorySegment
- Manufacturer
- Address
The difference between Unit Cost and Unit Price is fundamental in business and analytics, especially in profitability analysis.
🏷️ Unit Cost
- Definition: The amount it costs the company to produce or acquire one unit of a product.
- Includes: Raw materials, labor, manufacturing overhead, shipping, or wholesale purchase price.
- From Whose Perspective: Internal (business)
💰 Unit Price
- Definition: The price at which the product is sold to customers.
- Also Known As: Selling price, retail price.
- From Whose Perspective: External (customer)
We’ll first create two Star schemas, one for Sales and one for Budget, and then transform them into a Snowflake schema to improve performance and scalability.
🧱 Step 1: Load Data into Power BI
- Open Power BI Desktop.
- Click Home > Get Data and load all your tables.
- After importing, click Close & Apply to enter the data model view.
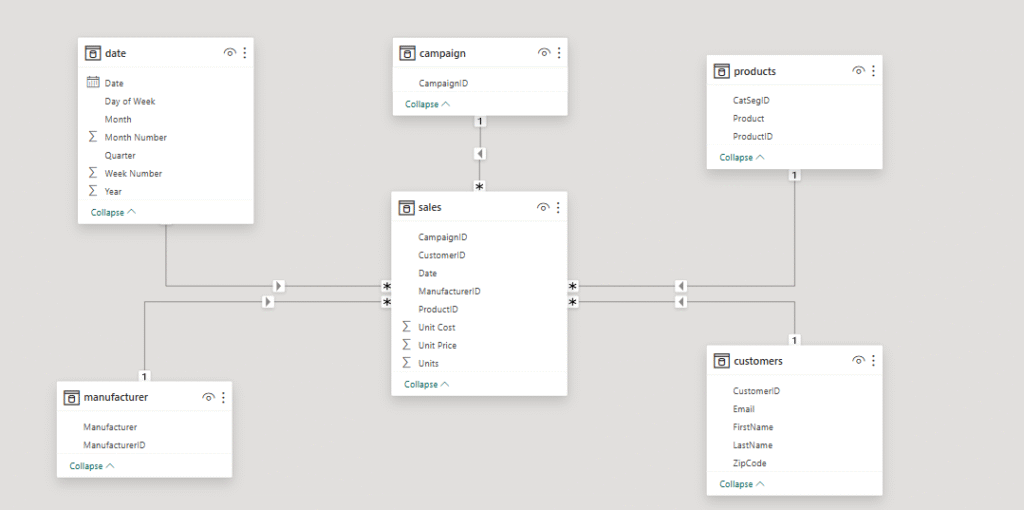
⭐ Step 2: Create the First Star Schema (Sales)
- In Model View, identify the
Salestable as your fact table. - Connect it to the following dimension tables:
- Customer via
CustomerID - Product via
ProductID - Date via
DateID - Campaign via
CampaignID(if applicable)
- Customer via
- Confirm relationships are:
- One-to-many
- Single-directional (by default)
✅ Result:
A clean Star Schema centered around the Sales fact table, providing fast performance and simplified relationships.
⭐ Step 3: Create the Second Star Schema (Budget)
- Identify
Budgetas your second fact table. - Link it to:
- Date via
DateID - Product via
ProductID
- Date via
✅ Result:
Now you have two Star schemas—Sales Star and Budget Star—co-existing in your model, ready for comparison and analysis.
❄️ Step 4: Convert to a Snowflake Schema
To optimize for reusability and normalization:
- Break out some dimension details:
- From
ProducttoCategorySegmentandManufacturer - From
CustomertoAddress
- From
- Update the relationships:
Productconnects toCategorySegmentandManufacturerCustomerconnects toAddress
✅ Result:
A Snowflake schema structure, where not all dimensions connect directly to fact tables—some go through intermediate tables.
📊 Step 5: Create Measures for Budget vs Sales Analysis
Create these DAX measures:
Total Sales = SUM(Sales[SalesAmount])
Total Budget = SUM(Budget[BudgetAmount])
Variance = [Total Sales] - [Total Budget]
Variance % = DIVIDE([Variance], [Total Budget])
📈 Step 6: Build Visuals
Use Power BI visuals to compare and analyze data:
- Bar Chart: Product-wise Budget vs Sales
- Line Chart: Date-wise trends
- KPI Card: Budget vs Actual Variance
💡 Step 7: Best Practices
- Prefer Star Schema for ease and performance.
- Use Snowflake Schema when:
- Dimensions are reused across models
- You want to normalize data
- Always use shared dimensions (like Date/Product) for fact-to-fact comparisons.
- Set up proper data types and relationships to avoid filter ambiguity.
🔚 Conclusion
By strategically combining Star and Snowflake schemas in Power BI, you gain both speed and flexibility in your reporting. This model lets you easily compare budget vs actuals, segment data, and support advanced reporting as your dataset grows.
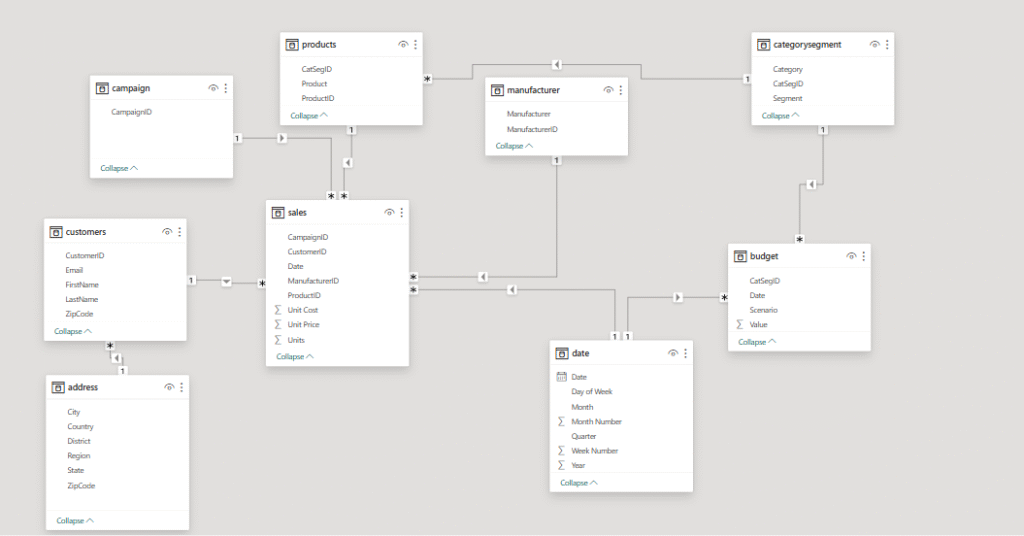
This is a snowflake schema.
How you can tell:
A snowflake schema is a type of data warehouse schema where:
- The central fact table (in this case, the
salestable) is connected to multiple dimension tables. - The dimension tables are normalized, meaning some dimensions are broken down into sub-dimensions.
In your diagram:
- Fact Table:
sales- Contains foreign keys like
CampaignID,CustomerID,ProductID,ManufacturerID,Date, etc. - Contains measures like
Unit Cost,Unit Price,Units.
- Contains foreign keys like
- Dimension Tables (some are normalized):
customers→ connected toaddress(this normalization is a snowflake trait).products→ hasCatSegIDlinking tocategorysegment.campaign,manufacturer,date, andcategorysegmentare also dimension tables.budgetis a special case—it could be treated as another fact table or a helper for planning/forecasting.
Key feature making it a snowflake and not a star:
- Normalization of dimension tables like
products→categorysegmentandcustomers→address.
In contrast, a star schema would have denormalized, flat dimensions connected directly to the fact table.
✅ So yes, your data model represents a snowflake schema.
