
In today’s data-driven world, organizations are constantly looking for ways to measure their progress, understand their performance, and achieve long-term goals. One of the most powerful tools that businesses, managers, and professionals rely on to track success is KPI, which stands for Key Performance Indicator.
But what exactly are KPIs, why do they matter, and how can you use them effectively? Let’s dive into a comprehensive breakdown of KPIs and how they can help transform decision-making in business, marketing, operations, and beyond.
Understanding KPIs: A Simple Definition
A Key Performance Indicator (KPI) is a measurable value that indicates how effectively an individual, team, or organization is achieving its objectives. KPIs act like a compass that helps businesses stay on track by providing insights into progress and performance against specific goals.
For example:
- A sales KPI might be “Monthly Revenue Growth.”
- A marketing KPI might be “Cost per Lead (CPL).”
- An HR KPI could be “Employee Retention Rate.”
- A customer service KPI might be “Average Response Time.”
Each KPI ties directly to a business objective. This makes them different from simple metrics. While a metric might just measure something (like total website visitors), a KPI connects that measurement to a strategic goal (like percentage of website visitors converting into paying customers).
Why KPIs Are Important
KPIs are not just numbers. They are decision-making tools. Organizations use KPIs to:
- Measure Progress
KPIs show whether you’re moving in the right direction. For example, if your business goal is to increase sales by 20% in the next year, KPIs such as “Monthly Sales Growth” can tell you how close you are to hitting that target. - Align Teams and Efforts
KPIs ensure that every team member is working toward the same objective. Sales, marketing, operations, and customer service can each have their own KPIs that align with the organization’s larger strategy. - Identify Problems Early
If KPIs show performance is falling short, managers can act quickly to fix issues before they escalate. - Improve Accountability
Since KPIs are measurable, they create a culture of accountability. Each department or individual knows what success looks like and can be evaluated fairly. - Drive Continuous Improvement
KPIs encourage ongoing monitoring and optimization. Businesses that track KPIs regularly can adapt to changes faster and stay ahead of competitors.
Types of KPIs
Not all KPIs are the same. Different situations call for different types of KPIs. Below are the main categories:
1. Quantitative KPIs
- These are number-based indicators.
- Example: “Revenue Generated,” “Number of New Customers,” “Conversion Rate.”
2. Qualitative KPIs
- These measure non-numerical aspects like customer satisfaction or employee engagement.
- Example: “Customer Satisfaction Score (CSAT).”
3. Leading KPIs
- These predict future outcomes.
- Example: “Number of Leads Generated” as a predictor of future sales.
4. Lagging KPIs
- These measure results after the fact.
- Example: “Quarterly Revenue” or “Net Profit Margin.”
5. Input KPIs
- These measure resources used to achieve goals.
- Example: “Marketing Spend” or “Training Hours per Employee.”
6. Process KPIs
- These measure the efficiency of processes.
- Example: “Order Fulfillment Time” or “Production Downtime.”
7. Outcome KPIs
- These measure the actual results achieved.
- Example: “Customer Retention Rate” or “Market Share.”
Examples of KPIs in Different Areas
Business & Finance
- Net Profit Margin – How much profit remains after all expenses.
- Cash Flow – The liquidity of the business.
- Revenue Growth Rate – Speed of financial growth.
Marketing
- Customer Acquisition Cost (CAC) – Cost of acquiring one new customer.
- Return on Marketing Investment (ROMI) – Profit generated from marketing activities.
- Website Conversion Rate – Percentage of visitors completing desired actions.
Sales
- Monthly Sales Growth – Increase in sales compared to previous month.
- Sales Target Achievement – Percentage of quota achieved.
- Average Deal Size – Value of a typical sales deal.
Human Resources
- Employee Retention Rate – Percentage of employees who stay.
- Absenteeism Rate – How often employees are absent.
- Time to Hire – How long it takes to fill a vacancy.
Customer Service
- First Response Time (FRT) – How fast a support team replies.
- Net Promoter Score (NPS) – Customer loyalty indicator.
- Resolution Rate – Percentage of issues solved on first attempt.
How to Set Effective KPIs
A KPI is only useful if it’s relevant, measurable, and actionable. Here are best practices to create powerful KPIs:
- Align with Business Goals
A KPI must directly connect to a strategic goal. If the goal is to expand into new markets, a KPI like “Number of Leads from Target Regions” would be relevant. - Use the SMART Framework
KPIs should be:- Specific – Clearly defined.
- Measurable – Quantifiable with data.
- Achievable – Realistic given resources.
- Relevant – Linked to business priorities.
- Time-bound – Measured within a specific timeframe.
- Keep KPIs Simple and Clear
Everyone in the organization should understand what the KPI means and how it’s measured. - Limit the Number of KPIs
Tracking too many KPIs can create confusion. Focus on the few that truly drive results. - Regularly Review and Update
Business goals change, and so should KPIs. Regular reviews keep them relevant.
Common Mistakes to Avoid with KPIs
While KPIs can be game-changing, many organizations fail to use them effectively. Common mistakes include:
- Tracking Vanity Metrics
Metrics like “Number of Social Media Followers” may look good but don’t always indicate business success. - Not Linking KPIs to Strategy
A KPI should always serve a business objective, not just measure activity. - Setting Unrealistic Targets
Goals that are too ambitious demotivate teams. - Failing to Communicate KPIs
Everyone should understand what KPIs are being measured and why. - Ignoring Context
Numbers without context can mislead. For instance, sales growth may look positive, but if profit margins are shrinking, the KPI needs reevaluation.
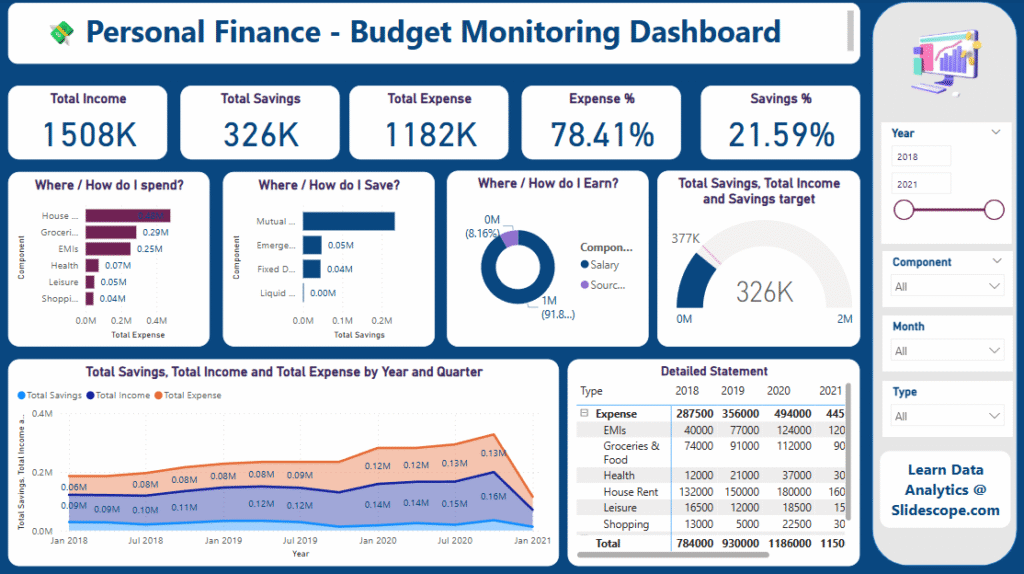
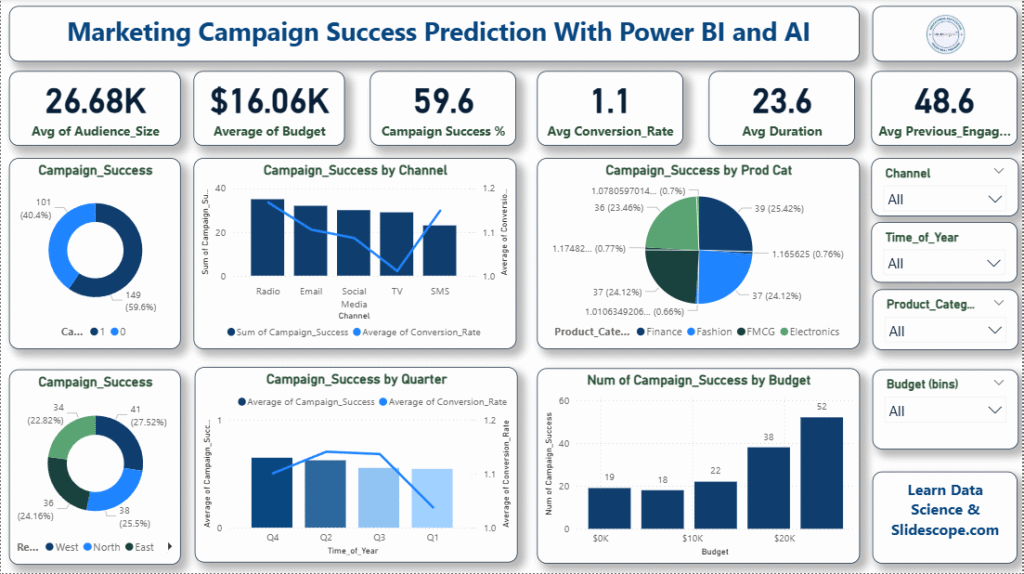
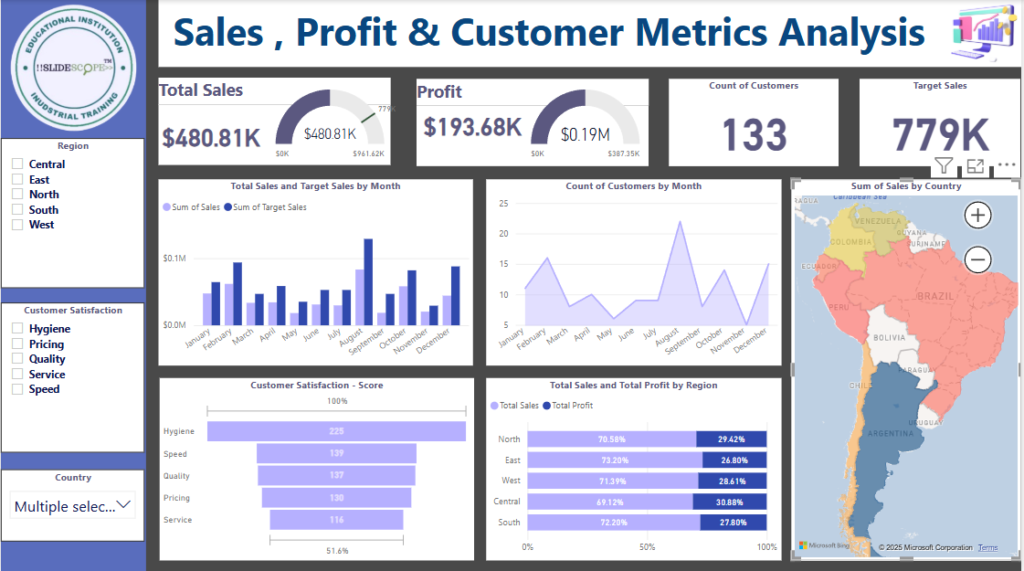
The Future of KPIs: Data Analytics and AI
In the digital age, KPIs are evolving beyond traditional spreadsheets. Advanced data analytics tools like Power BI, Tableau, and Google Looker Studio now enable businesses to track KPIs in real time with interactive dashboards.
Moreover, AI-driven analytics are making KPIs smarter by:
- Predicting trends through machine learning.
- Identifying hidden patterns in performance data.
- Recommending actions to improve outcomes.
Organizations that embrace these advanced KPI-tracking methods gain a competitive edge by making faster and more accurate decisions.
Why Learning About KPIs Matters for Your Career
Whether you’re a business owner, marketer, analyst, or student, understanding KPIs is a career superpower. Employers value professionals who can:
- Translate complex data into actionable insights.
- Align performance with business strategy.
- Drive measurable improvements in efficiency and profitability.
Learning about KPIs and data analytics equips you with the skills to thrive in today’s job market and prepare for the future of work.
Final Thoughts
Key Performance Indicators (KPIs) are more than numbers—they are powerful tools that guide businesses, teams, and individuals toward success. By setting clear, relevant, and measurable KPIs, organizations can align strategy, track progress, and make data-driven decisions that improve performance.
In a world where data drives every industry, mastering KPIs and analytics is no longer optional—it’s essential.
Ready to Master KPIs and Data Analytics?
If you want to learn how to track, analyze, and use KPIs effectively to boost business performance, it’s time to build your data analytics skills.
👉 Learn Data Analytics Course at Slidescope
This comprehensive course is designed to help professionals and students master data visualization, business intelligence tools, and performance measurement strategies to become future-ready in the world of data.
Take the next step in your career today!
