Hi, I’m Ankit, and over the years I have worked with businesses, startups, educational institutions, and digital teams that rely heavily on data-driven decisions. One thing I consistently noticed is that organizations collect massive amounts of data, but very few professionals know how to transform that raw information into meaningful visual stories. That is where Data Visualization Specialists create real impact.
Today, companies do not just want reports filled with numbers. They want dashboards, charts, KPIs, trends, and visual insights that help management take quick and strategic decisions. Whether it is digital marketing analytics, sales tracking, finance reporting, healthcare data, or supply chain intelligence, visualization has become one of the most valuable skills in the modern data ecosystem.
A Data Visualization Specialist is not simply a designer creating colorful charts. This role combines analytical thinking, business understanding, storytelling, and technical expertise. Professionals in this field help organizations identify trends, detect problems, measure performance, and communicate insights clearly to decision-makers.
The best part about this career is that it is open to students, working professionals, marketers, engineers, analysts, and even non-technical learners willing to develop practical skills. Tools like Microsoft Excel, Power BI, Tableau, Looker Studio, Python, and SQL have made visualization more accessible than ever before.
In this roadmap, I will explain the complete step-by-step journey to becoming a Data Visualization Specialist. These points are based on practical industry experience and the real expectations companies have from modern data professionals.
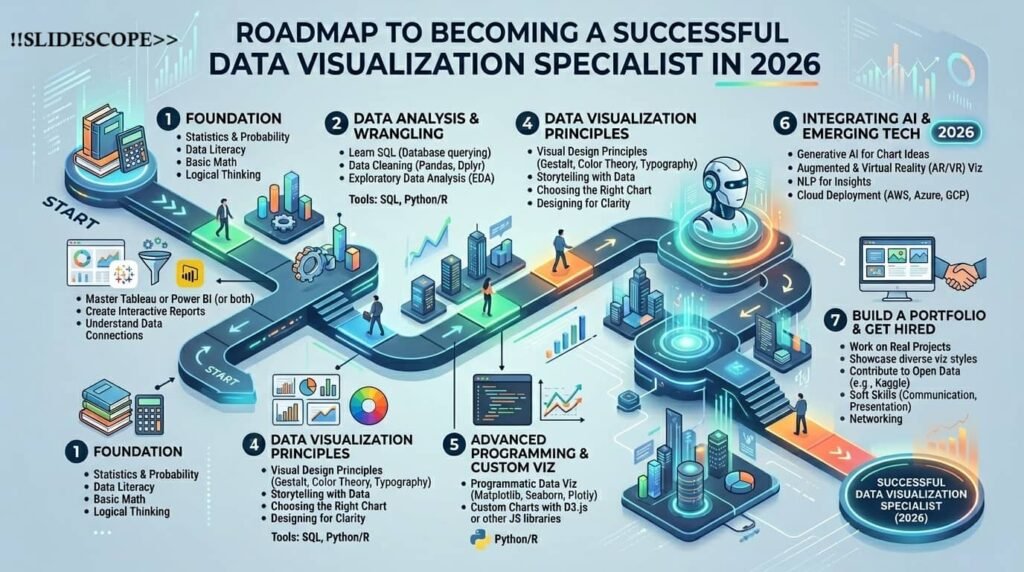
1. Understand the Fundamentals of Data and Analytics
Before creating dashboards or visual reports, you must understand how data works. Learn concepts like structured data, datasets, rows, columns, KPIs, metrics, dimensions, and business reporting. A strong foundation helps you interpret information correctly instead of only designing charts. Understanding analytics fundamentals also improves your decision-making abilities and enables you to create meaningful visualizations that solve real business problems across industries.
2. Master Microsoft Excel for Data Visualization
Excel remains one of the most important tools for every Data Visualization Specialist. Learn formulas, pivot tables, charts, conditional formatting, slicers, dashboards, and data cleaning techniques. Many businesses still rely on Excel for reporting and analytics. Advanced Excel skills help you organize raw datasets efficiently and create professional visual reports that communicate trends, comparisons, and business performance in an understandable manner.
3. Learn SQL for Data Extraction and Management
A Data Visualization Specialist must know how to access and manage data from databases. SQL helps you retrieve, filter, join, and analyze data efficiently. Learn SELECT statements, JOINS, GROUP BY, WHERE conditions, subqueries, and aggregations. SQL knowledge allows you to work with real-world datasets directly from databases and makes you more valuable to organizations handling large volumes of business information daily.
4. Build Expertise in Power BI and Tableau
Modern businesses heavily use visualization platforms like Power BI and Tableau for dashboard reporting. Learn dashboard creation, DAX formulas, calculated fields, filters, drill-through analysis, interactive visuals, and report publishing. These tools help transform complex data into visually engaging insights. Strong expertise in visualization platforms significantly increases your employability because companies actively seek professionals who can build dynamic business intelligence solutions.
5. Develop Data Cleaning and Transformation Skills
Raw business data is often incomplete, duplicated, or inconsistent. A visualization specialist must know how to clean and transform datasets before analysis. Learn Power Query, Excel cleaning methods, SQL transformations, and ETL basics. Proper data preparation improves accuracy and ensures reliable reporting. Organizations highly value professionals who can convert messy raw data into clean, analysis-ready information for dashboards and executive reporting systems.
6. Learn the Principles of Visual Storytelling
Data visualization is not only about charts and graphs. It is about storytelling through data. Learn color psychology, chart selection, layout design, readability, user experience, and audience-focused reporting. A good dashboard should communicate insights instantly without confusion. Strong storytelling skills help decision-makers understand patterns quickly and allow businesses to take faster actions based on visually presented analytical insights and trends.
7. Understand Business Domains and KPIs
Different industries use different metrics and reporting structures. Learn how KPIs work in digital marketing, finance, healthcare, sales, manufacturing, education, and eCommerce sectors. Domain knowledge helps you design dashboards relevant to business objectives. Companies prefer specialists who understand operational goals rather than professionals who only know software tools. Business understanding improves the practical value and effectiveness of visualization projects significantly.
8. Build Real Projects and Portfolio Dashboards
Practical projects are essential for becoming a successful Data Visualization Specialist. Create dashboards using real or sample datasets for sales analysis, marketing campaigns, finance tracking, HR analytics, or supply chain management. Publish your work on GitHub, LinkedIn, or portfolio websites. A strong project portfolio demonstrates your capabilities better than certifications and helps employers evaluate your real-world analytical and visualization skills effectively.
9. Learn Basic Python for Advanced Visualization
Python is becoming increasingly important in analytics and visualization careers. Learn libraries like Pandas, Matplotlib, and Plotly for advanced reporting and automation. Python helps process large datasets, automate repetitive tasks, and create custom visualizations. While Excel and Power BI are important, Python adds flexibility and technical depth to your skill set, making you capable of handling advanced analytical workflows efficiently.
10. Focus on Communication and Continuous Learning
Technical knowledge alone is not enough in this field. A Data Visualization Specialist must communicate insights clearly to teams, managers, and clients. Improve presentation skills, business communication, and report explanation techniques. The analytics industry evolves rapidly, so continuous learning is essential. Stay updated with new tools, AI-driven analytics, dashboard trends, and business intelligence technologies to remain competitive and future-ready in the evolving digital landscape.
Conclusion
The journey to becoming a Data Visualization Specialist is one of the most rewarding career paths in today’s digital economy. Businesses across every industry are generating enormous amounts of data every single day. However, raw data alone has no value unless someone can interpret, organize, and present it in a way that supports strategic decision-making. This is exactly why Data Visualization Specialists are becoming critical assets for modern organizations.
In my experience, one of the biggest misconceptions people have is that visualization is only about designing charts or making dashboards look attractive. In reality, this profession requires analytical thinking, business understanding, communication skills, technical expertise, and creativity. A successful visualization professional bridges the gap between data and decision-making.
The demand for skilled professionals in this field is growing rapidly because organizations are moving toward data-driven cultures. Companies now rely on dashboards for monitoring sales performance, customer behavior, digital marketing campaigns, operational efficiency, employee productivity, financial planning, and supply chain management. Executives no longer want lengthy spreadsheets filled with numbers. They want clear visual insights that help them understand problems and opportunities immediately.
One of the greatest advantages of entering this field is flexibility. Students from technical and non-technical backgrounds can both build successful careers in data visualization. Whether you are from commerce, engineering, management, IT, marketing, or science backgrounds, you can enter this domain by learning practical tools and business analytics concepts.
Another important aspect is that the learning curve is gradual. You do not need to master every tool at once. Start with Excel because it builds analytical thinking and reporting fundamentals. Then move toward SQL and Power BI or Tableau. As you gain confidence, explore advanced technologies like Python, AI analytics, automation, and cloud-based business intelligence systems.
Practical implementation is extremely important. Theoretical knowledge alone cannot make you an expert. The best way to grow is by working on projects continuously. Create dashboards using real-world datasets. Analyze marketing campaigns, sales performance, finance reports, HR metrics, or social media data. Every project improves your analytical mindset and visualization abilities.
Portfolio building is another major factor that many learners ignore. Employers and clients prefer seeing actual dashboards rather than only certificates. A strong portfolio proves your ability to solve business problems visually. Publish dashboards on LinkedIn, GitHub, or personal websites to showcase your skills professionally.
Communication also plays a major role in this profession. A dashboard becomes valuable only when stakeholders understand the insights clearly. Many technically strong professionals struggle because they cannot explain analytical findings effectively. Therefore, focus on storytelling, presentation, and business communication along with technical skills.
The future of data visualization is also evolving with Artificial Intelligence and automation. AI-powered analytics tools can now generate insights automatically, but organizations still need skilled professionals who can interpret those insights correctly and align them with business objectives. Human analytical thinking and contextual understanding remain extremely valuable.
As businesses continue digital transformation, the importance of visualization specialists will increase even more. Startups, multinational companies, healthcare institutions, government departments, educational organizations, and eCommerce brands all require professionals capable of turning data into actionable intelligence.
My recommendation for aspiring professionals is simple: focus on consistency instead of speed. Learn step-by-step, practice daily, build projects regularly, and stay curious about business data. Over time, your expertise will naturally grow. Data visualization is not just a technical skill; it is a career that allows you to influence business strategies, improve decision-making, and create measurable impact through insights.
If you stay committed to continuous learning and practical execution, becoming a successful Data Visualization Specialist is absolutely achievable in 2026 and beyond.
