A step-by-step Google Analytics 4 guide for website owners, marketers and analysts
– Written by Ankit
If you want to understand where your website audience is coming from, Google Analytics 4 (GA4) gives you a simple starting point: Active users by Country. But the real value comes when you compare that audience across traffic groups such as All Users, Direct traffic, Organic traffic and Paid traffic. In this guide, I will show you how to find the country report, apply comparisons, read the results correctly, and turn the data into practical marketing decisions.
1. Understand What Active Users by Country Means
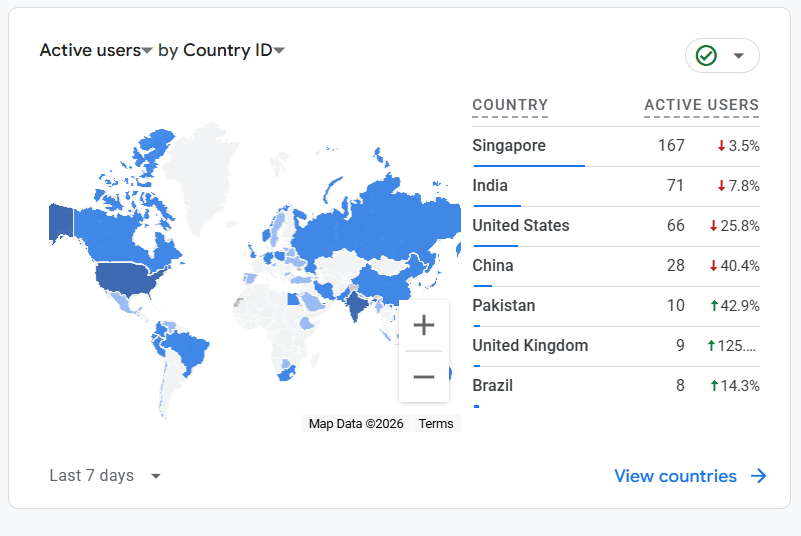
The Active users by Country view shows the countries from which users are accessing your website or app, along with the number of active users associated with those countries. GA4 automatically provides the Country dimension, so you normally do not need to create a custom dimension for this basic geographic analysis. Google explains that geography information such as country, region and city is approximated using IP-based location information.
The important word here is active. GA4 defines Active users as unique users who engaged with your site or app during the selected date range. This is different from simply counting every person or every session. That distinction matters when you compare countries, because a country with fewer sessions can still have a meaningful number of active users.
2. Open the GA4 Reports Area
Step 1: Sign in to Google Analytics
Open your Google Analytics account and select the GA4 property connected to the website you want to analyze. Make sure you are working in the correct property before interpreting the numbers.
Step 2: Open Reports
In the left-hand navigation, select Reports. GA4’s reporting area contains predefined overview reports and detail reports. The exact cards visible on an overview page can vary because administrators and editors can customize reports.
Step 3: Open the User attributes report
Look for the User attributes or demographic/geographic reporting area. Depending on how your property is configured, you may see an overview card called Active users by Country. Google describes this card as a view of the top countries where active users are coming from.
Step 4: Choose Active users by Country
Review the map and country table. The map gives you a quick visual picture, while the table is better for identifying the countries with the largest active-user counts.
Suggested Screenshot 1 — GA4 Active users by Country map and country table
3. Use the Country Detail Report for Deeper Analysis
The overview card is useful, but for analysis I recommend opening the detailed country report. Look for the option such as View countries. This takes you to a report where Country is used as a dimension and Active users is one of the metrics you can analyze. GA4 detail reports are designed to let you sort and analyze the table, and the dimension picker can be used to change or add dimensions when the report supports them.
Once you are in the detailed report, confirm the date range before drawing conclusions. In your example, the report is set to Last 7 days. A seven-day window is useful for recent performance, but it can be too short for a business with low traffic or strong weekly fluctuations. For strategic decisions, compare several date ranges rather than relying on one snapshot.
4. Apply Comparisons in GA4
This is the part that makes the report much more useful. GA4 Comparisons allow you to evaluate different subsets of your data side by side. Google provides saved comparisons for common use cases, including direct and organic traffic in many properties. You can also create your own comparison using dimensions and dimension values.
Step 5: Open the comparison control
At the top of the report, select the comparison control. GA4 will show the currently applied comparison, often All Users, and may display additional saved comparisons.
Step 6: Select the traffic groups
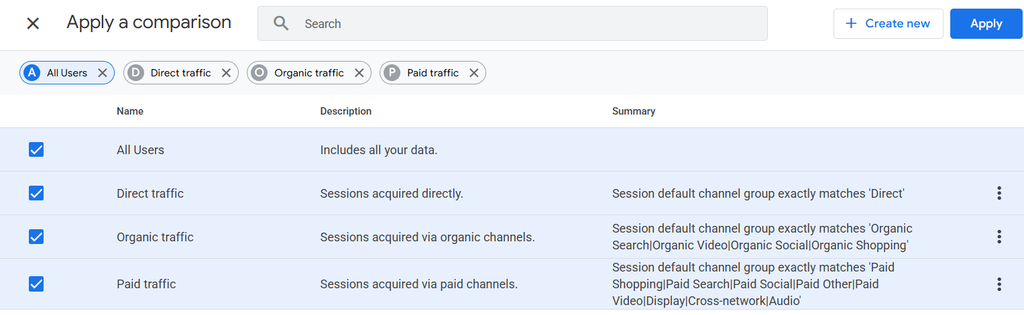
Choose the comparisons you want to analyze. In your example, the useful groups are All Users, Direct traffic, Organic traffic and Paid traffic. You can select or create comparisons depending on what is available in your property.
Step 7: Create a comparison when necessary
If a required comparison is missing, choose Create new. Select the relevant dimension, choose a match type such as exact matching, select the appropriate dimension value, and then apply the comparison. GA4 supports multiple conditions, with multiple values within the same condition evaluated using OR logic and separate conditions evaluated using AND logic.
Step 8: Click Apply
After applying the comparisons, GA4 presents the selected data groups in the report. The report can then be read as a country-by-country comparison rather than as one undifferentiated audience.
Suggested Screenshot 2 — GA4 Apply a comparison screen
5. What the Main Comparisons Mean
All Users
This is your broad baseline. It represents the overall data available to the report before you narrow the analysis to a particular comparison. Use it as the reference point when judging whether a traffic segment is over- or under-represented in a country.
Direct traffic
Direct traffic in GA4 is not limited to people who literally typed your URL. GA4 uses direct/(none) when it cannot determine a clear referral source. This can happen with typed URLs and bookmarks, but also with missing campaign information, some offline documents, redirects, URL handling issues and other situations where source information is lost. Therefore, do not automatically assume every direct user intentionally entered the website address.
Organic traffic
Organic traffic represents visits attributed to organic channels. When analyzing SEO performance, compare organic traffic against All Users by country. A country that has a strong overall audience but relatively weak organic traffic may indicate an opportunity to improve localized SEO, search visibility or content relevance.
Paid traffic
Paid traffic represents users attributed to paid acquisition channels. Comparing paid traffic by country helps you understand where advertising is actually reaching users. It can also expose cases where a campaign is attracting users from countries that were not part of your intended market.
6. How to Read a Country Comparison
Suppose your All Users report shows Singapore at the top, followed by India and the United States. That tells you where your overall active audience is concentrated during the selected period. Now turn on Organic traffic. If India becomes much more prominent in the organic comparison, SEO may be particularly important for that market. If the United States dominates Paid traffic but not Organic traffic, your advertising strategy may be responsible for a larger share of U.S. acquisition.
The key is to compare proportions and patterns, not just raw numbers. A country with 100 active users is not automatically more valuable than a country with 50. You should also examine engagement, key events, conversions, revenue, landing pages and the business value of those users. Country data tells you where users are; it does not by itself tell you which market is most profitable.
Use these comparisons for SEO planning, paid-media targeting, international expansion and campaign measurement. The strongest workflow is to identify a country pattern, check the traffic source behind it, and then validate it with engagement, key events, conversions or revenue.
Do not treat active users as sessions or pageviews.
Do not assume all Direct traffic means typed-in traffic.
Do not make major decisions from a very short date range.
Do not judge a market by user volume alone; check business outcomes.
Remember that country location is an approximation.
8. Common Mistakes to Avoid
9. A Simple Analysis Workflow I Recommend
Keep the workflow simple: start with All Users, compare Organic and Paid traffic, then inspect Direct traffic carefully. This sequence shows whether different acquisition channels are reaching the same countries or different markets.
Finally, move from users to outcomes. Check engagement, key events, conversions or revenue so you optimize for business value rather than traffic volume.
FAQ: GA4 Active Users by Country and Comparisons
How do I see active users by country in GA4?
Open your GA4 property, go to Reports, find the User attributes/geographic report and open Active users by Country. Use the detailed country report for deeper analysis.
Can I compare organic and direct traffic by country?
Yes. Apply Organic traffic and Direct traffic comparisons to the country report to evaluate their geographic distribution.
What does Active users mean in GA4?
Active users are unique users who engaged with your website or app during the selected date range.
Why is Direct traffic higher than expected?
Direct/(none) can include users whose source information was unavailable because of missing campaign data, redirects, offline documents and other attribution limitations.
Can GA4 show country automatically?
Yes. Country is a predefined geography dimension and is automatically populated for website and app data.
Why are country numbers different from another GA4 report?
Reports can differ because they may use different dimensions, date ranges, comparisons, data processing and reporting surfaces. Always verify the exact report, metric and date range before comparing numbers.
Should I target a country just because it has many active users?
Not necessarily. High user volume is a signal, not a final decision. Check engagement, conversions, revenue, lead quality and your ability to serve that market before increasing investment.
Conclusion
GA4’s Active users by Country report gives you the geographic picture, while comparisons explain how different acquisition sources contribute to each market.
Do not treat the map as a standalone report. Follow the chain: country → traffic source → engagement → conversions or revenue. This turns a simple geographic report into a useful marketing decision-making tool.
GA4 Guide — Written by Ankit

Ankit Srivastava is an IT trainer, technology educator, and digital skills mentor with expertise in programming, data analytics, AI, and software development. He has successfully trained thousands of learners, with more than 10,000 student enrollments on Udemy. His practical teaching approach empowers students and professionals to build in-demand technical skills. Colorstech channel where Ankit posts video tutorials has more than 8000 Subscribers.