Business Intelligence has become an important part of modern organizations because businesses need more than raw data—they need systems that transform data into meaningful information for decision-making. A Business Intelligence (BI) Developer works at the intersection of data, technology, reporting, and business requirements. The role involves connecting data sources, transforming and modeling data, developing dashboards, creating reports, and delivering reliable analytical solutions.
For students learning Power BI and Tableau, becoming a BI Developer can be a natural progression from dashboard creation into a broader technical career. A BI Developer needs to understand visualization tools, but also needs strong foundations in SQL, databases, data modeling, ETL, business requirements, and BI architecture.
At Slidescope, practical exposure to tools such as Power BI and Tableau can provide a strong starting point. With experience creating 100+ Tableau dashboards and 300+ Power BI projects, Ankit’s practical approach can also help students understand how dashboards are designed for real business scenarios rather than simply learning individual software features.
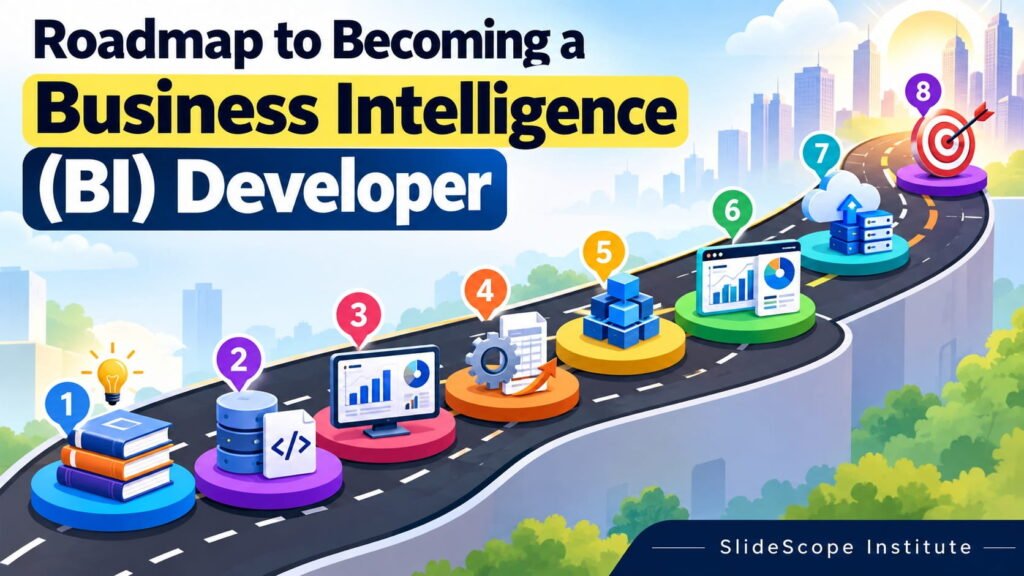
The following eight-step roadmap provides a structured path from fundamentals to professional BI development.
1. Build Strong Foundations in Data and Business Intelligence
Before becoming a BI Developer, students should understand what Business Intelligence actually means. BI is not simply the process of creating attractive charts. It involves collecting data, preparing it, analyzing it, and presenting information that helps organizations make informed business decisions.
Start by learning fundamental concepts such as structured and unstructured data, databases, tables, rows, columns, metrics, dimensions, KPIs, reports, dashboards, and data sources. Students should also understand the difference between operational systems and analytical systems.
Business understanding is equally important. A BI Developer may receive a requirement such as, “Management wants to understand why sales have declined.” The developer must translate that requirement into measurable KPIs, relevant dimensions, data requirements, and useful visualizations.
Learn common business areas such as sales, marketing, finance, human resources, inventory, customer service, and operations. Understanding these domains makes it easier to design meaningful BI solutions.
Students should also become comfortable reading datasets and asking questions such as: What does this data represent? Which columns are important? What relationships exist? What business problem can this data answer?
This foundation prevents students from becoming tool-dependent dashboard creators and prepares them to think like BI professionals.
2. Master SQL and Relational Databases
SQL is one of the most important technical skills for a BI Developer. Power BI and Tableau can provide powerful visualization capabilities, but BI developers frequently need to retrieve, filter, combine, aggregate, and validate data before it reaches the dashboard.
Begin with SQL fundamentals including SELECT, WHERE, ORDER BY, GROUP BY, aggregate functions, aliases, filtering, and conditional logic. Then progress to joins, subqueries, Common Table Expressions, views, window functions, and more advanced analytical queries.
Students should understand relational database concepts such as primary keys, foreign keys, relationships, normalization, and indexing. They should practice working with databases such as SQL Server, MySQL, PostgreSQL, or similar platforms.
Practical exercises are more valuable than memorizing syntax. For example, create a sales database containing customers, products, orders, employees, and regions. Then write queries to calculate revenue, profit, monthly sales, customer retention, regional performance, and product performance.
SQL also becomes important when troubleshooting BI dashboards. If a dashboard displays an incorrect number, a BI Developer needs to determine whether the problem originates in the visualization, data model, transformation logic, or source query.
Strong SQL skills therefore provide the technical foundation required to move from basic dashboard development toward professional BI development.
3. Become Highly Proficient in Power BI and Tableau
Power BI and Tableau are two major BI visualization platforms, and students should develop strong practical skills in at least one while understanding the fundamentals of the other.
For Power BI, students should learn Power Query, data loading, transformations, relationships, data modeling, DAX, calculated columns, measures, visualizations, filters, slicers, drill-through, bookmarks, tooltips, report navigation, publishing, workspaces, and dashboard sharing.
For Tableau, students should understand data connections, dimensions, measures, calculated fields, parameters, filters, sets, groups, dashboards, stories, actions, and interactive visualizations.
The goal should not be to memorize every feature. Instead, students should learn how to select the appropriate feature for a business requirement.
Practical project experience is particularly valuable. Rather than creating only tutorial dashboards, students should build projects around realistic business scenarios such as sales analysis, marketing performance, HR analytics, financial reporting, supply-chain monitoring, customer analytics, and executive reporting.
Creating numerous dashboards also develops an important skill: visual judgment. After building many dashboards, students begin recognizing common problems such as excessive charts, poor hierarchy, unnecessary colors, confusing filters, and inappropriate visualizations.
The objective is to become capable of taking raw business data and turning it into an interactive, understandable BI report.
4. Learn Data Cleaning, Power Query and ETL
A BI Developer rarely receives perfectly prepared data. Real-world data can contain duplicate records, missing values, inconsistent formats, incorrect data types, spelling variations, unnecessary columns, and multiple tables that need to be combined.
This makes data preparation an essential BI skill.
Students using Power BI should become comfortable with Power Query and understand how ETL works: Extract, Transform, and Load. Learn how to import data from Excel, CSV files, databases, APIs, folders, and other sources. Then practice removing duplicates, handling null values, splitting and merging columns, changing data types, replacing values, filtering records, appending tables, and merging datasets.
Tableau users should similarly understand data preparation and connection concepts, including joins, unions, relationships, and data-source management.
Students should also understand why transformations should be performed efficiently. Loading unnecessary columns or millions of irrelevant records can affect performance and maintainability.
Build projects where data comes from multiple files or sources. For example, combine monthly sales files, customer information, product details, and regional data into a unified analytical dataset.
The important mindset is that BI development begins before the dashboard. A beautiful visualization built on unreliable data is still an unreliable BI solution.
By mastering data cleaning and ETL concepts, students become better prepared for the messy datasets commonly encountered in professional BI projects.
5. Master Data Modeling and DAX
Data modeling is one of the skills that separates a dashboard user from a BI Developer. A BI Developer must understand how different tables relate to one another and how those relationships affect analytical results.
Students should learn concepts such as fact tables, dimension tables, primary keys, foreign keys, relationships, cardinality, star schema, and snowflake schema. The star schema is particularly important for designing efficient analytical models.
For Power BI developers, DAX becomes another major skill. Students should understand measures, calculated columns, filter context, row context, and common functions such as CALCULATE, SUM, SUMX, COUNTROWS, FILTER, ALL, RELATED, and time-intelligence functions.
Instead of simply copying DAX formulas, students should understand why a calculation produces a particular result.
Practice creating business metrics such as Total Sales, Gross Profit, Profit Margin, Year-over-Year Growth, Month-to-Date Sales, Year-to-Date Sales, Average Order Value, Customer Count, and Conversion Rate.
Tableau developers should similarly understand calculated fields, level-of-detail expressions, table calculations, parameters, and aggregation behavior.
Data modeling should always be connected to business requirements. A well-designed model makes reports easier to build, calculations more reliable, and BI solutions easier to maintain.
This stage is critical because BI Developers are responsible not only for what users see but also for the analytical structure behind the report.
6. Learn Dashboard Design and Business Storytelling
Technical BI skills alone are not enough. A BI Developer must know how to communicate information clearly through dashboards.
Start by learning fundamental visualization principles such as hierarchy, alignment, spacing, typography, consistency, contrast, filtering, and visual emphasis. Understand when to use bar charts, line charts, tables, cards, scatter plots, maps, and other visualization types.
A dashboard should answer business questions rather than simply display available data.
For example, a sales dashboard could begin with revenue, profit, and growth KPIs. It could then show monthly trends, regional performance, product performance, and customer segments. Filters can allow users to investigate specific periods, regions, or products.
Students should learn to distinguish between an executive dashboard and an operational dashboard. Executives may need a concise overview of business performance, while operational teams may require detailed transactional information.
Storytelling also means creating a logical flow. Users should immediately understand what the dashboard is about, what changed, where problems exist, and where they can investigate further.
Build multiple versions of the same dashboard and improve them based on usability.
With experience across hundreds of Power BI projects and more than 100 Tableau dashboards, students can learn an important lesson: dashboard development improves through repetition, comparison, testing, and refinement—not through tool knowledge alone.
7. Understand BI Service, Deployment and Performance
A professional BI Developer needs to understand what happens after a dashboard has been created.
For Power BI, students should learn about Power BI Service, workspaces, publishing, sharing, apps, scheduled refreshes, gateways, permissions, dashboards, semantic models, and deployment concepts. They should understand how reports move from development environments into environments where business users can access them.
Security is another important area. Learn concepts such as Row-Level Security (RLS) and understand how different users can be restricted to the data they are authorized to view.
Performance optimization should also become part of the learning process. Students should understand why excessive visuals, inefficient DAX, unnecessarily large datasets, poor data models, and inefficient transformations can make reports slower.
Tableau students should learn comparable concepts around Tableau Server or Tableau Cloud, publishing, permissions, extracts, refreshes, and performance considerations.
BI Developers should also understand the importance of documentation. A professional BI project should make it possible for another developer or administrator to understand the data sources, transformations, calculations, refresh process, and business definitions.
This stage moves students beyond creating dashboards on their computers and toward understanding how BI solutions operate within an organization’s wider technology environment.
8. Build a Professional BI Portfolio and Prepare for the Job
The final step is turning technical knowledge into demonstrable professional capability.
Students should build a portfolio containing several complete BI projects rather than dozens of disconnected practice dashboards. Each project should represent a realistic business problem and demonstrate the complete process—from source data and transformation through modeling, calculations, visualization, insights, and final recommendations.
A strong portfolio could include projects such as Sales & Profit Analysis, Marketing Campaign Analytics, HR Analytics, Financial Performance, Customer Segmentation, Supply Chain Analytics, and Executive Business Reporting.
For every project, document the business problem, data sources, cleaning process, data model, important calculations, dashboard design decisions, and key findings.
Students should also prepare for technical interviews. Practice SQL questions, DAX problems, data-modeling scenarios, dashboard-design questions, and business-case discussions. Be prepared to explain not only what you built but why you built it that way.
GitHub, LinkedIn, a personal portfolio website, and BI community profiles can be used to showcase selected work.
Finally, keep learning. BI platforms, cloud technologies, AI-assisted analytics, semantic models, automation, and modern data platforms continue to evolve.
The goal is to demonstrate that you can solve business problems with data—not simply that you know how to operate Power BI or Tableau.
Conclusion
Becoming a BI Developer is a gradual process that combines business understanding, SQL, data preparation, data modeling, BI tools, visualization, deployment, and problem-solving.
Power BI and Tableau can provide the visualization foundation, but professional BI development requires a much broader skill set. Students should progressively move from understanding data to querying databases, preparing datasets, designing analytical models, creating dashboards, deploying BI solutions, and communicating insights.
A practical project-based approach is particularly valuable. Building hundreds of dashboards is not about collecting dashboard designs; it is about developing the judgment required to choose the right data, calculation, visualization, layout, and analytical approach for different business problems.
For Slidescope students, this roadmap can serve as a progression from learning Power BI or Tableau → building projects → developing BI expertise → preparing for BI Developer roles.
The strongest portfolio is not necessarily the one containing the most dashboards. It is the one that demonstrates a clear ability to take a business requirement, work with imperfect data, build a reliable analytical model, create an effective BI solution, and explain the resulting information clearly.
That is the journey from BI tool learner to Business Intelligence Developer.

Ankit Srivastava is an IT trainer, technology educator, and digital skills mentor with expertise in programming, data analytics, AI, and software development. He has successfully trained thousands of learners, with more than 10,000 student enrollments on Udemy. His practical teaching approach empowers students and professionals to build in-demand technical skills. Colorstech channel where Ankit posts video tutorials has more than 8000 Subscribers.