K Means Clustering is an algorithm of Unsupervised Learning. You can apply this algorithm on datasets without labeled output data.Only Input data is there an we have a goal of finding regularities in data to group or cluster like items together.
You can copy the code an run it line by line in Jupyter Notebook.
Watch the videos given in the bottom of this post to understand the process clearly.
What is a Cluster – Datapoints aggregated together because of certain similarities
import numpy as np

import matplotlib.pyplot as plt

# Import the algorithm from scikitlearn https://scikit-learn.org

from sklearn.cluster import KMeans

# Get the dataset of wine https://archive.ics.uci.edu/ml/datasets/wine

names = ['Class', 'Alcohol', 'Malic acid', 'Ash', 'Alcalinity of ash', 'Magnesium', 'Total phenols', \

'Flavanoids', 'Nonflavanoid phenols', 'Proanthocyanins', 'Color intensity', 'Hue', 'OD280/OD315',\

'Proline']

data = pd.read_csv('https://archive.ics.uci.edu/ml/machine-learning-databases/wine/wine.data', names = names)

data.head(100)

data['Class'].value_counts().plot(kind='bar')

data.plot.scatter(x = 'Alcohol', y = 'OD280/OD315', figsize=(8,5))

data.plot.scatter(x = 'Alcohol', y = 'OD280/OD315', c= 'Class', figsize=(8,5), colormap='jet')

data.iloc[:,[12,1]].head()

# kmeans = Kmeans().fit(data)

# kmeans = KMeans(n_clusters = 2)

# kmeans.fit(X)

# kmeans.cluster_centers_

# kmeans.labels_

kmeans = KMeans(n_clusters=3, init = 'random', max_iter = 1, random_state = 5).fit(data.iloc[:,[12,1]])
centroids_df = pd.DataFrame(kmeans.cluster_centers_, columns = list(data.iloc[:,[12,1]].columns.values))
fig, ax = plt.subplots(1, 1)
data.plot.scatter(x = 'Alcohol', y = 'OD280/OD315', c= kmeans.labels_, figsize=(12,8), colormap='jet', ax=ax, mark_right=False)
centroids_df.plot.scatter(x = 'Alcohol', y = 'OD280/OD315', ax = ax, s = 80, mark_right=False)
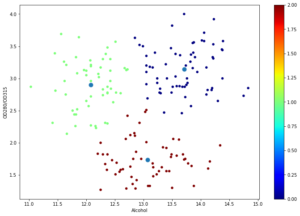
kmeans = KMeans(n_clusters=3, init = 'random', max_iter = 150, random_state = 5).fit(data.iloc[:,[12,1]])
centroids_df = pd.DataFrame(kmeans.cluster_centers_, columns = list(data.iloc[:,[12,1]].columns.values))
fig, ax = plt.subplots(1, 1)
data.plot.scatter(x = 'Alcohol', y = 'OD280/OD315', c= kmeans.labels_, figsize=(12,8), colormap='jet', ax=ax, mark_right=False)
centroids_df.plot.scatter(x = 'Alcohol', y = 'OD280/OD315', ax = ax, s = 80, mark_right=False)