Supervised machine learning is a type of machine learning in which the algorithm is trained on a labeled dataset, where the input data and corresponding output data are already known. The algorithm learns to map the input data to the correct output data by using the labeled examples provided during the training phase. The primary goal of supervised learning is to build a predictive model that can accurately predict the output for new, unseen input data.
Here are some examples of supervised machine learning:
- Image classification: Given a dataset of images, where each image is labeled with a specific category (such as cat, dog, or car), the algorithm learns to identify the category of new, unseen images.
- Spam detection: Given a dataset of emails, where each email is labeled as either spam or not spam, the algorithm learns to identify new, unseen emails as spam or not spam.
- Regression analysis: Given a dataset of input-output pairs, where the output is a continuous value (such as temperature, price, or stock market value), the algorithm learns to predict the output for new, unseen input data.
- Sentiment analysis: Given a dataset of text documents, where each document is labeled as positive, negative, or neutral, the algorithm learns to classify new, unseen text documents based on their sentiment.
In all of these examples, the algorithm is trained on labeled data and learns to make predictions on new, unseen data by mapping the input data to the corresponding output data.
In simple words, if in a dataset Input Variables and Target variables both are given, then it is a problem of supervised machine learning.
For example: In Titanic Dataset, Survived is the target variable and all other variables are input variables.
You can view titanic dataset here : https://github.com/datasciencedojo/datasets/blob/master/titanic.csv
The Titanic dataset is a classic example of supervised machine learning. The goal of the problem is to predict whether a passenger survived the sinking of the Titanic based on a number of input features such as age, gender, ticket class, and embarkation port.
In this case, the input data consists of various features that describe the passengers on the Titanic, such as their age, gender, ticket class, and whether they had family members on board. The output data is a binary variable that indicates whether the passenger survived or not.
To train a supervised machine learning algorithm on this dataset, we first need to split the data into two sets: a training set and a test set. The training set is used to train the algorithm, while the test set is used to evaluate its performance on new, unseen data.
Next, we need to choose an appropriate algorithm for the task. In this case, we could use a binary classification algorithm such as logistic regression, decision trees, or random forests.
Once we have chosen an algorithm, we can train it on the training set by providing it with the input features and corresponding output labels. The algorithm learns to map the input features to the correct output label by minimizing the difference between its predictions and the true labels in the training set.
Finally, we can evaluate the performance of the algorithm on the test set by providing it with the input features and comparing its predictions to the true labels. We can use various metrics such as accuracy, precision, recall, and F1-score to measure the performance of the algorithm.
If the performance of the algorithm is satisfactory, we can use it to make predictions on new, unseen data, such as the data for passengers on the Titanic that were not included in the original dataset.
Another Example of Supervised Machine Learning with Numerical Input and Output Data
You can view the data here https://github.com/codebasics/py/blob/master/ML/1_linear_reg/Exercise/canada_per_capita_income.csv
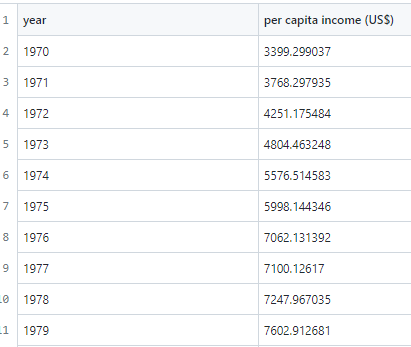
The Canada per capita income dataset is another example of supervised machine learning. The goal of the problem is to predict the per capita income of Canada for future years based on the historical data.
In this case, the input data consists of the years, and the output data is the corresponding per capita income for each year. To train a supervised machine learning algorithm on this dataset, we first need to split the data into two sets: a training set and a test set. The training set is used to train the algorithm, while the test set is used to evaluate its performance on new, unseen data.
Next, we need to choose an appropriate algorithm for the task. In this case, we could use a regression algorithm such as linear regression, polynomial regression, or support vector regression.
Once we have chosen an algorithm, we can train it on the training set by providing it with the input feature (years) and corresponding output label (per capita income). The algorithm learns to map the input feature to the correct output label by minimizing the difference between its predictions and the true labels in the training set.
Finally, we can evaluate the performance of the algorithm on the test set by providing it with the input feature (years) and comparing its predictions to the true labels. We can use various metrics such as mean squared error, root mean squared error, and R-squared to measure the performance of the algorithm.
If the performance of the algorithm is satisfactory, we can use it to make predictions on future years’ per capita income, based on the input feature (years). We can also use the algorithm to analyze the historical data and identify trends or patterns that may help us to better understand the factors that affect per capita income in Canada.Regenerate response
