How to plot Boxplot in Python
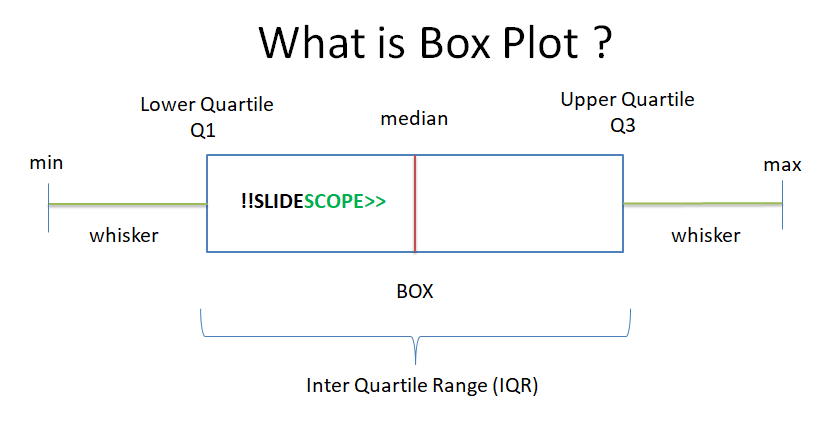
A box plot is used to visualize 5 values in a dataset for the selected column(s): Minimum Value First Quartile or 25% Median (Second Quartile) or 50% Third Quartile or 75% Maximum value Box Plot is also known as Box and Whisker Plot. Steps – Load the dataset using Pandas dataframe Select any column to …